
Enchancing Visual Reasoning in Calculus: introducing a New Typology of Graphical Tasks
Valentina Kostic1), Tanja Sekulic2)
1)Academy of Applied Technical and Preschool Studies Nis - Department Pirot (Serbia)
2)Technical College of Applied Sciences in Zrenjanin (Serbia)
https://doi.org/10.53656/math2025-2-4-evr
Abstract. This paper emphasizes the introduction of the innovative typology of tasks in calculus education to enhance students’ visual reasoning skills. The proposed typology includes graphical tasks that require students to engage with images to derive meanings, justify solutions, and foster a deeper conceptual understanding of function derivatives. By integrating these tasks, we aim to address the imbalances in mathematics education regarding traditional approach, which often favors algebraic over graphical representation. This new typology will help students develop a well-rounded understanding, bridging the gap between symbolic manipulation and graphical interpretation.
Keywords: visualization; graphical tasks; calculus; derivative
[emember_protected for='16-8-24' format_protected_msg='1' custom_msg='Влезте в системата, за да прочетете пълната статия']
Introduction
One possible way to incorporate visual reasoning into mathematical education and curriculums in general, and particularly in calculus, is to introduce tasks where students will be compelled to use images to engage meanings, justify, and produce solutions. In the literature, for these kind of tasks (tasks with graphical content and/or requirements) different terms are used: graphical tasks, visualized tasks, visual reasoning tasks, etc. In this paper, we will use the term graphical tasks.
This paper will present an approach to task assignment based on the principles of visualization. The new typology of tasks that will be presented can illustrate the process and manner of implementing specific tasks designed for the purposes of teaching and learning in the field of calculus, and more precisely of function's derivatives.
Theoretical background
The Visual representations (pictures, diagrams, graphs) are essential for understanding mathematical concepts and communication. Mathematical visualization involves creating and manipulating representations (Hitt 1997). The connection between visual and symbolic representations can be challenging, especially for students focused on algebraic methods.
Calculus requires understanding both algebraic and graphical representations (Dunham & Osborne 1991). Conceptual understanding includes interpreting graphs (Vinner 1989; Zimmerman 1991), transitioning between representations (Habre & Abboud 2006), solving problems (Selden & Mason 1994), and understanding kinematic interpretations (Botzer & Yerushalmy 2008).
Teaching calculus is complex. Graphical representations pose difficulties for students (Gagatsis & Kyriakides 2003), while traditional methods prioritize algebraic approaches (Hitt 2002). Students often struggle with visual representations due to limited experience.
Understanding derivatives is crucial in calculus, involving functions, quotients, limits, and tangents. Students often face misconceptions (Asiala et al. 1997; Aspinwall et al. 1997; Berry & Nyman 2003; Orton 1983; Ubuz 2007) and difficulties with the limiting process (Biza et al. 2006; Vincent et al. 2015; Tall 2010).
2.2. Visual approach vs. the traditional one in Calculus
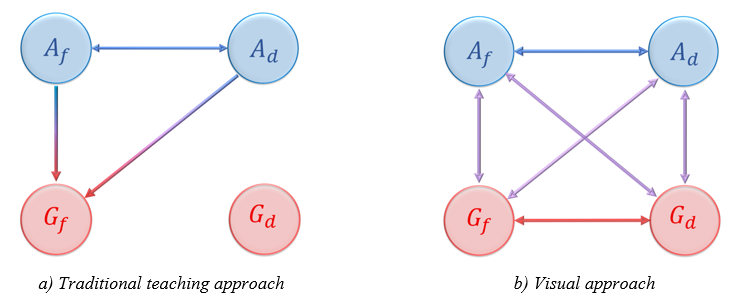
Traditional and visual approaches differ in methodology. To simplify representation-based comparisons, we introduce notations: (algebraic function), (algebraic derivative), (graphical function), and (graphical derivative).
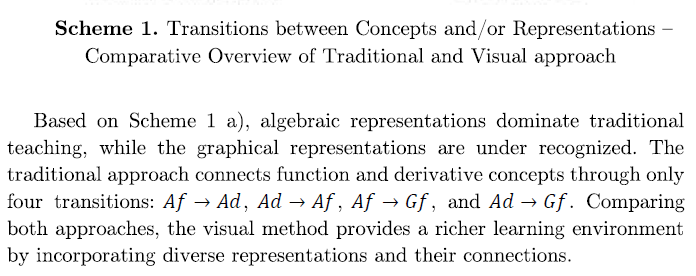
The notation refers to algebraic representations related to the concept of a function. The notation refers to graphical representations related to the concept of a function. Similarly, refers to algebraic, and to graphical representations related to the concept of a function derivative. The traditional teaching concept and the visual approach concept, after these notations are introduced, can be presented schematically (Scheme 1).
Graphical tasks and the derivative of a function
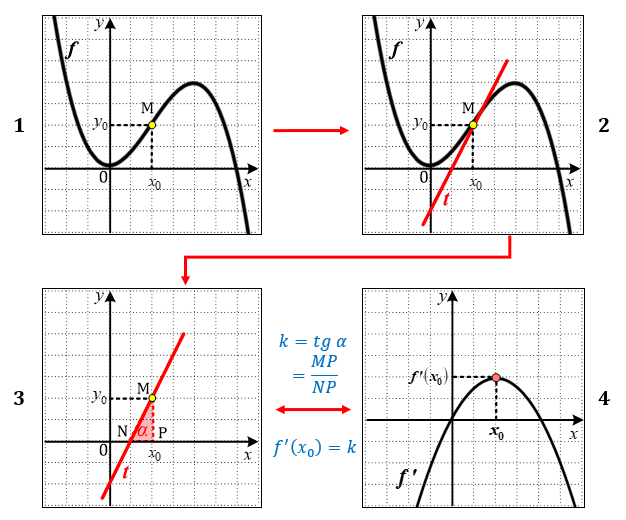
A graphical understanding of derivatives requires knowledge of function graphs, tangents, slopes, and derivative function’s graphs. Transitioning between these representations involves referential connections. The first two transitions (1st→ 2nd, 2nd → 3rd) are visual, while linking the tangent's slope to the derivative graph (3rd → 4th) relies on algebraic knowledge: the tangent’s slope coefficient 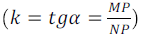 and the derivative at a point
 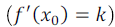 . Understanding the tangent’s slope as the derivative's value is cognitively demanding, requiring coordination between visual and symbolic abstraction.

3.1. Typology of graphical tasks from the field of function derivatives
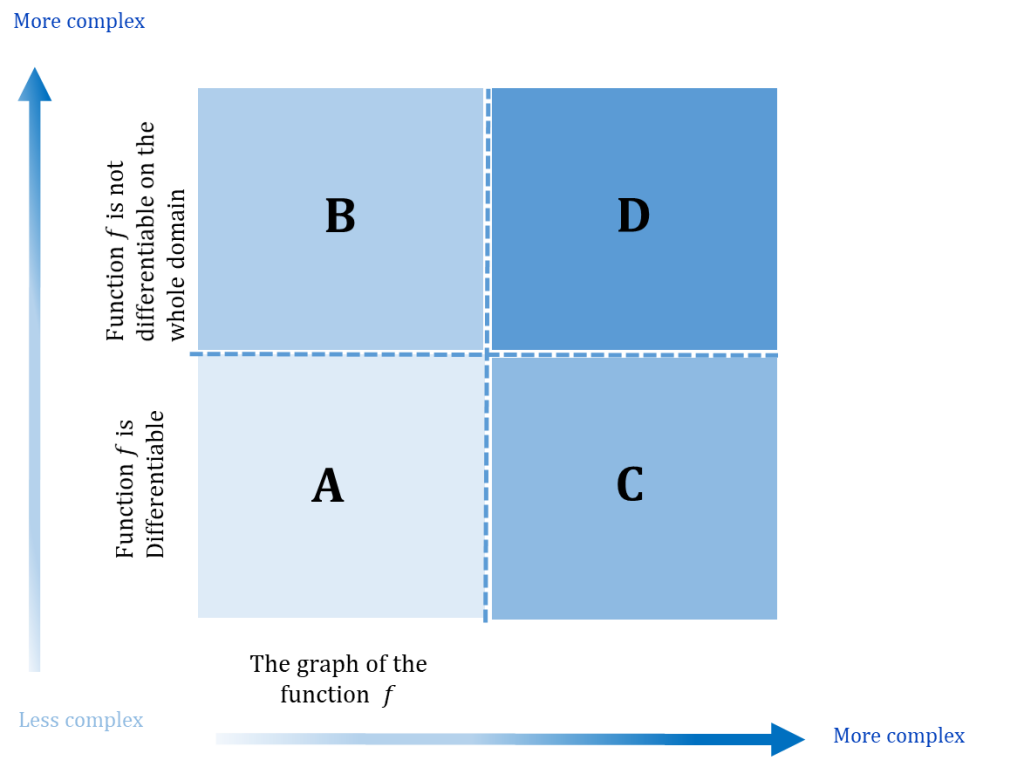
To address multiple representations and mathematical visualization in calculus, original tasks with graphical content were designed. Given their broad methodological potential, tasks were classified by various criteria, forming a typology. Theoretical research identified four key characteristics of such tasks, determining their complexity and difficulty (Table 1).
Table 1. Factors influencing the complexity of requirements and the level of difficulty of tasks with graphical content and/or requirements
| Lower Complexity /Lower Requirements | Higher Complexity /Higher Requirements |
| Working with the graph of a function | Working with the graph of derivative function |
| Considering a differentiable function | Considering a function that is not differentiable at all points in its domain |
| Considering local properties of the function/derivative function | Considering global properties of the function/derivative function |
| Interpreting graphical representations | Constructing graphical representations |

To vary task complexity within each type, two additional criteria are applied: consideration of the local/global properties of functions and derivatives, and interpretation/construction of graphical representations.
The task typology enables designing and selecting graphical tasks on function derivatives, creating a structured, progressively complex problem series.
There are series of graphical tasks including various contents from differential calculus: geometric meaning of the first derivative, monotonicity of functions, local and global extrema, convexity. We will present tasks for the geometric meaning of the derivative – the concept of the tangent.

3.2. The application of graphical tasks in teaching and learning derivatives of functions (the concept of the tangent)
The visual approach expands and enriches traditional teaching materials with a new type of tasks with graphical content and/or requirements. These tasks contain a visual component of the geometric interpretation of the first derivative, which is precisely what traditional tasks lack. For the treatment of the geometric interpretation of the first derivative, we have designed and created four types of tasks (Type A, B, C, and D) with graphical content and/or requirements. Below, we provided some examples of tasks of Type A, B, C, and D and explained in detail their characteristics.
Type A tasks
Type A tasks, noted in the literature (Asiala et al. 1997), provide a strong methodological basis for developing a graphical understanding of derivatives and testing students' knowledge of a function’s derivative at a point.
These tasks help students interpret the slope of the tangent to the graph of a function as the value of the derivative function at a point. Since students typically understand slope algebraically, they may face difficulties with graphical tasks. Guidance is needed to ensure they extract relevant data from the graph by correctly reading the coordinate grid.
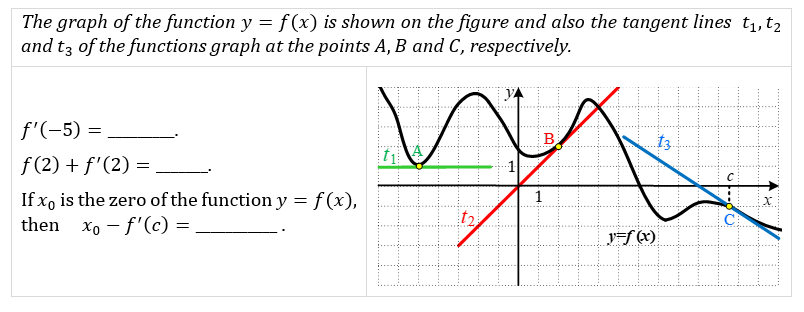
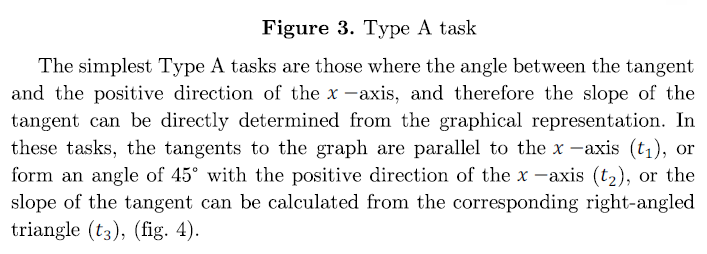
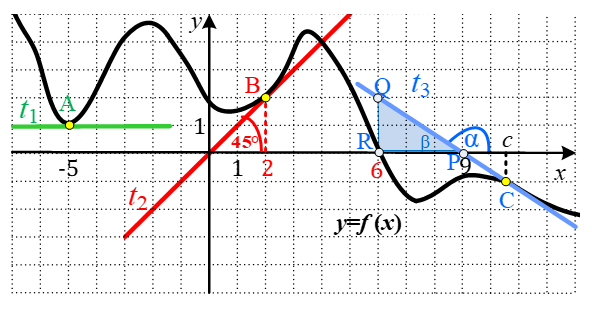
Type A tasks include a graphical representation of differentiable function () and its tangent (). Based on this, students determine the derivative of the function at a point (Ad) and an algebraic local property (), such as function value, zeros, or local extrema (fig. 3).

Type B tasks
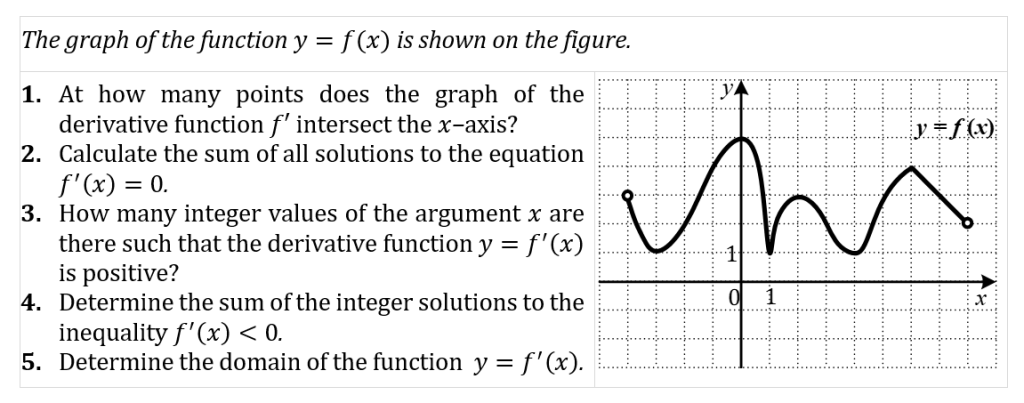
Type B tasks involve a function’s graph that is not differentiable across its entire domain, focusing on properties of its derivative. These properties are considered in both algebraic and graphical forms, and include domain, zeros, and sign.
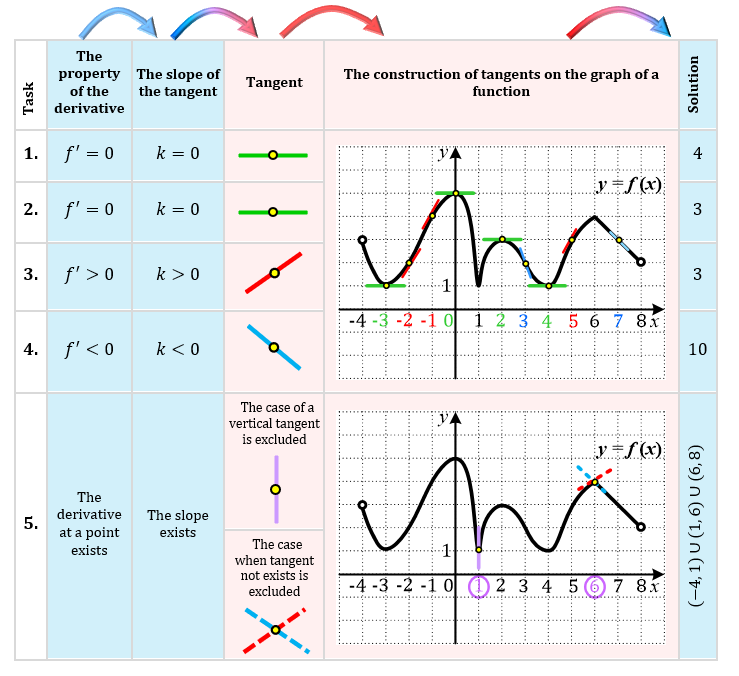
In the problem-solving process, the students are required to draw or mentally visualize tangents on the graph, developing an internal representation of the tangent. In other words, these tasks require that students have an internal, mental representation of the tangent, which they can display as an external graphical representation through drawing, but also manipulate mentally without drawing (fig. 5).
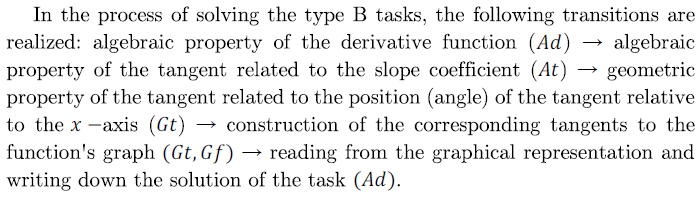

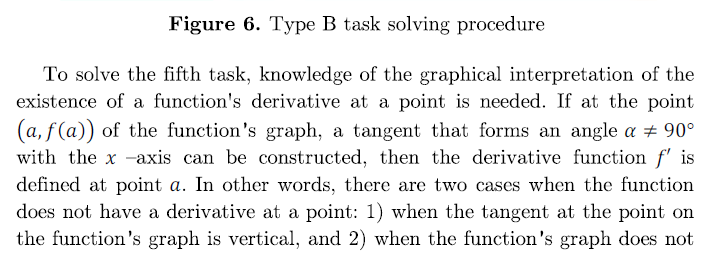
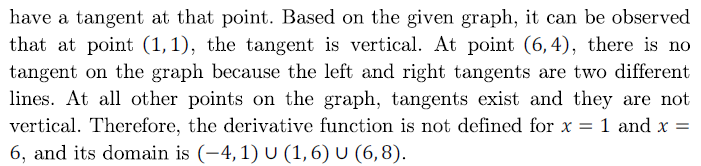
When solving type B tasks, critical points of the function’s graph are examined from the tangent’s perspective, not as extrema or inflection points. Emphasis is placed on connecting the critical point, the (im)possibility of constructing a tangent, its slope, and the corresponding derivative property.
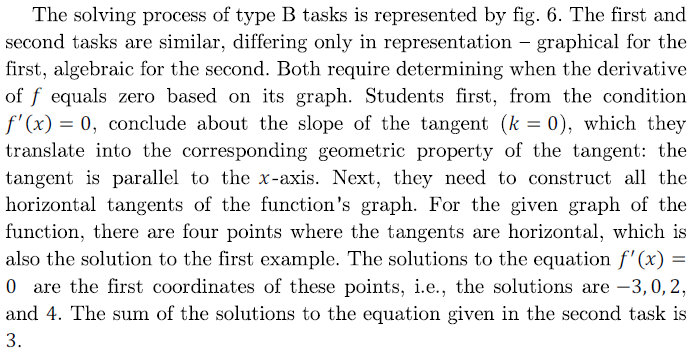
The first four tasks require examining some local property of the derivative function, while the fifth task considers a global property, the domain of the derivative function. It should be noted that determining the domain of the derivative function based on the graph of the function, or "reading differentiability" from the graph, is not a formal proof but is very important for understanding this concept.
A complete graphical understanding of differential calculus requires reversible connections between concepts. Reversibility, a key aspect of mathematical thinking, supports relational understanding and flexibility. Type A and B tasks establish one-way connections from a function’s graph to the graphical/algebraic properties of its derivative. Next, type C and D tasks reverse this process, analyzing function properties based on the derivative’s function graph.
Type C tasks
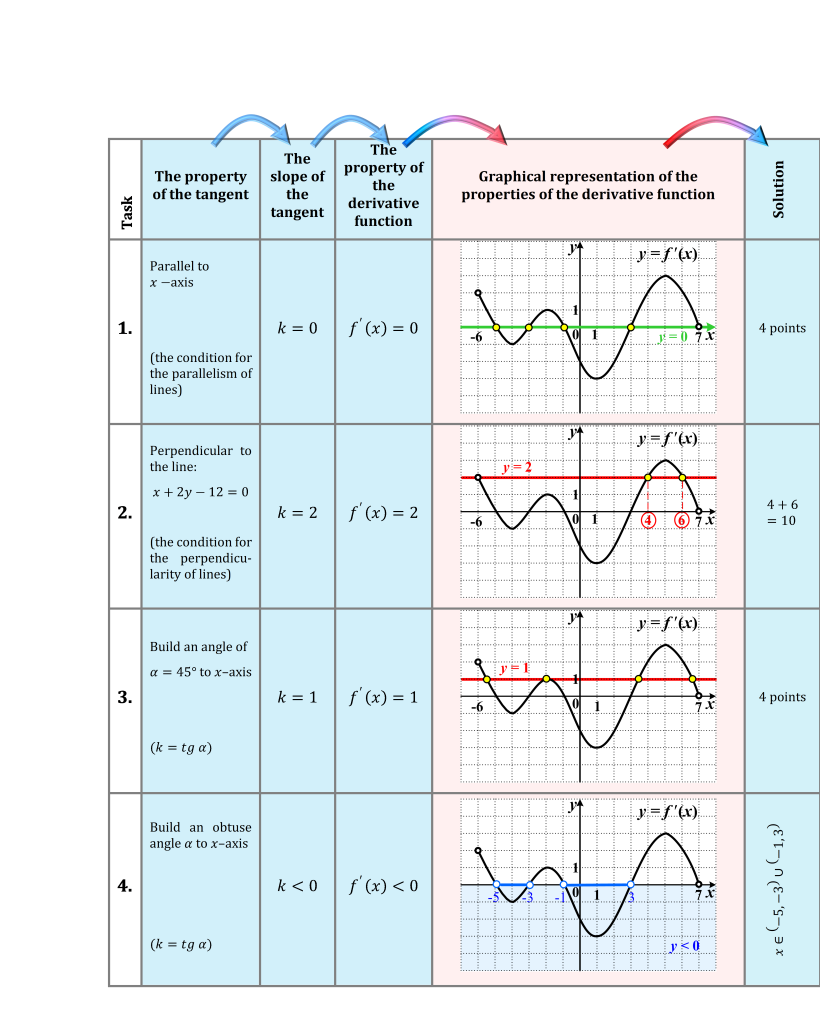
In type C tasks, differentiable functions are considered. Based on the graph of the derivative function provided in the task, certain properties of the function are examined, particularly those related to the tangent(fig. 7).
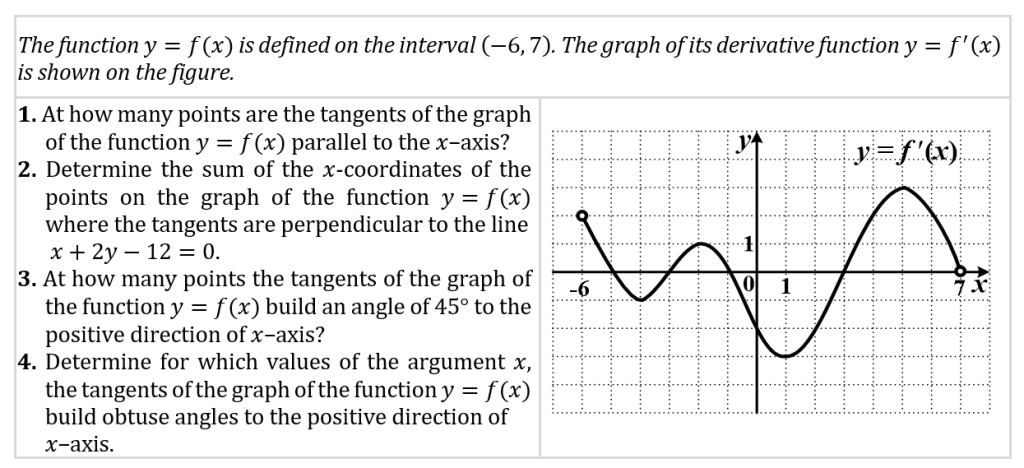

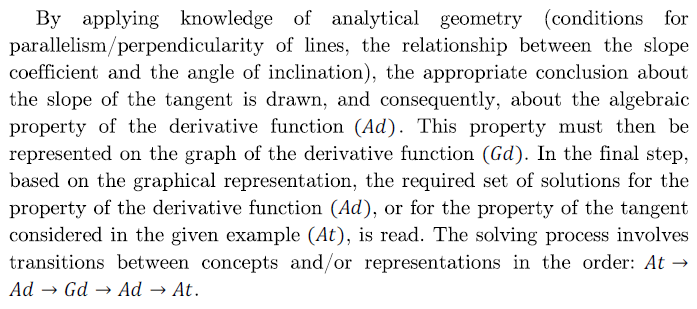
The procedure for solving the given type C tasks is illustrated in fig. 8. In all four tasks, algebraic data about a specific property of the tangent  is provided.

Type D tasks
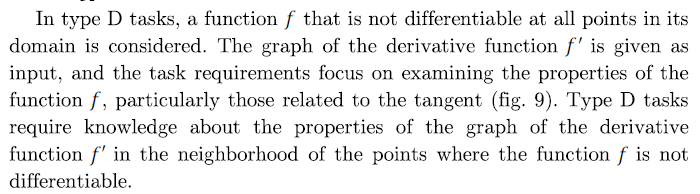
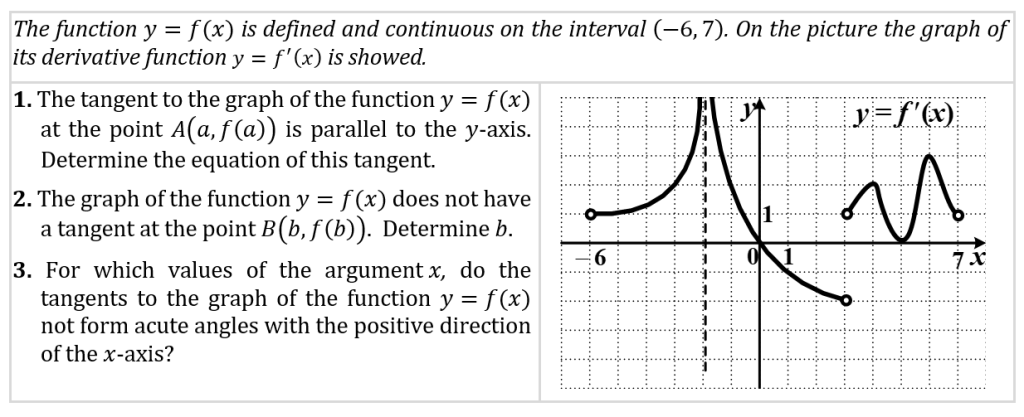

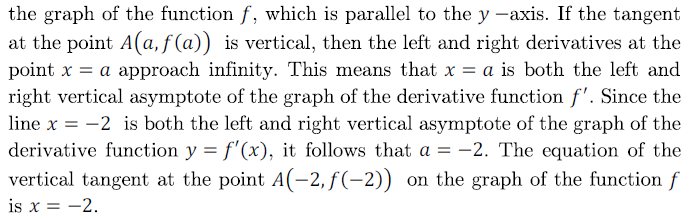
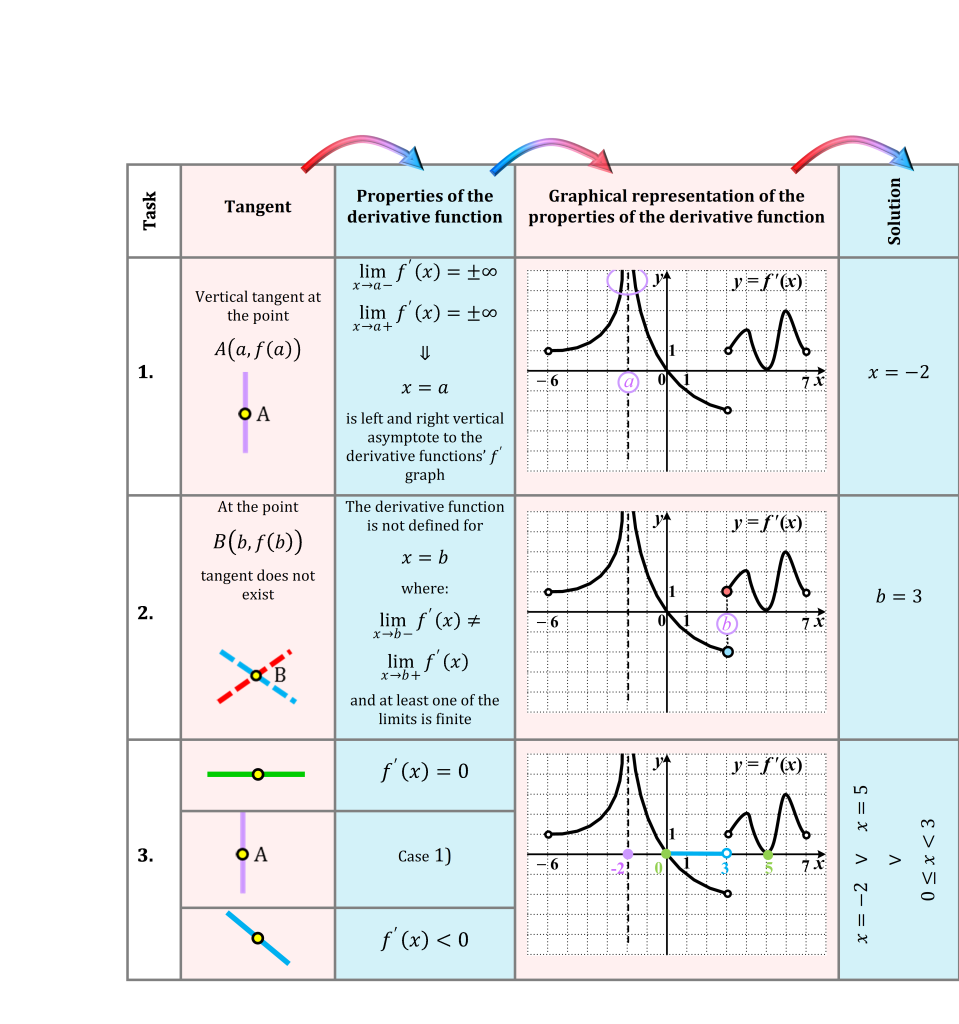
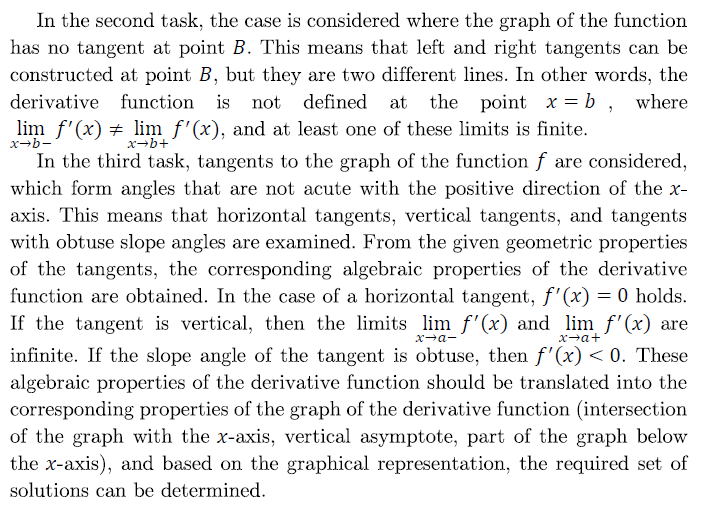
Fig. 10 illustrates the procedures for solving the mentioned type D tasks. In the first task, it is necessary to determine the equation of the tangent to

Conclusions
This approach not only improves students' ability to interpret and create graphical displays but also enhances their flexibility in transitioning between different representations of mathematical concepts. It encourages the development of higher-order thinking skills, such as problem-solving and critical analysis, which are essential for tackling novel and non-routine problems. Furthermore, integrating visual reasoning tasks into the curriculum leverages the potential of digital technologies and educational software, making learning more interactive and engaging.
In summary, the proposed typology of graphical tasks provides a valuable framework for enhancing the teaching and learning of calculus, promoting a deeper and more holistic understanding of mathematics. By prioritizing visual reasoning alongside traditional methods, educators can create a more inclusive and effective learning environment that serves to diverse learning styles and needs.
REFERENCES
ARCAVI, A., 2003. The role of visual representations in the learning of mathematics. Educational Studies in Mathematics, vol. 52, no. 3, pp. 215 – 241.
ASIALA, M., COTTRILL, J., DUBINSKY, E., & SCHWINGENDORF, K. E., 1997. The development of students' graphical understanding of the derivative. The Journal of Mathematical Behavior, vol. 16, no. 4, pp. 399 – 431.
ASPINWALL, L., SHAW, K. L., & PRESMEG, N. C., 1997. Uncontrollable mental imagery: Graphical connections between a function and its derivative. Educational Studies in Mathematics,vol. 33, no. 3. Pp. 301 – 317.
BERRY, J. S., & NYMAN, M. A., 2003. Promoting students’ graphical understanding of the calculus. The Journal of Mathematical Behavior, vol. 22, no. 4, pp. 479 – 495.
BIZA, I., CHRISTOU, C., & ZACHARIADES, T., 2006. Students' thinking about the tangent line. In: J. Novotna, H. Moraova, M. Kratka & N. Stehlikova (Eds.). Proceedings of the 30th PME International Conference. Prague, Czech Republic, vol. 2, pp. 177 – 184.
BOTZER, G., & YERUSHALMY, M., 2008. Embodied semiotic activities and their role in the construction of mathematical meaning of motion graphs. International Journal of Computers for Mathematical Learning, vol. 13, no. 2, pp. 111 – 134.
CLEMENTS, M. K. A., 2014. Fifty years of thinking about visualization and visualizing in mathematics education: A historical overview. In: Mathematics & Mathematics Education: Searching for Common Ground. Springer Netherlands, pp. 177 – 192.
DUNHAM, P. H., & OSBORNE, A., 1991. Learning How to See: Students Graphing Difficulties. Focus on Learning Problems in Mathematics, vol. 13, no. 4, pp. 35 – 49.
GAGATSIS, A., ELIA, E., & KYRIAKIDES, L., 2003. The nature of multiple representations in developing mathematical relationships. In: N. Pateman, B. Dougherty, & J. Ziliox (Eds.), Proceedings of the 2003 Joint Meeting of PME and PMENA. Honolulu, Hawaii: USA, vol. 1, pp. 287 – 287.
HABRE, S., & ABBOUD, M., 2006. Students’ conceptual understanding of a function and its derivative in an experimental calculus course. The Journal of Mathematical Behavior, vol. 25, no. 1, pp. 57 – 72.
HITT, F., 1997. Researching a Problem of Convergence with Mathematica: History and Visualisation of a Mathematical Idea. International Journal of Mathematical Education in Science and Technology, vol. 28, no. 5, pp. 697 – 706.
HITT, F., 2002. Representations and mathematics visualization. North American Chapter of the International Group for the Psychology of Mathematics Education. Mexico City: Cinvestav-IPN.
ORTON, A., 1983. Students' understanding of differentiation. Educational Studies in Mathematics, vol. 14, no. 3, pp. 235 – 250.
PRESMEG, N. C., 2006. Research on visualization in learning and teaching mathematics. In: A. GUTIERREZ & P. BOERO (Eds.), Handbook of research on the psychology of mathematics education: Past, present, and future. Netherlands: Springer, pp. 205 – 235.
SELDEN, J., SELDEN, A., & MASON, A., 1994. Even good calculus students can't solve nonroutine problems. MAA notes, pp. 19 – 28.
TALL, D., 2010. A sensible approach to the calculus. Plenary address to the Fourth National and International Meeting on the Teaching of Calculus, 23–25 September, Puebla, Mexico. Retrieved from http://homepages.warwick.ac.uk/staff/David.Tall/pdfs/dot2010a-sensible-calculus.pdf.
UBUZ, B., 2007. Interpreting a graph and constructing its derivative graph: stability and change in students’ conceptions. International Journal of Mathematical Education in Science and Technology, vol. 38, no. 5, pp. 609 – 637.
VINCENT, B., LARUE, R., SEALEY, V., & ENGELKE, N., 2015. Calculus students' early concept images of tangent lines. International Journal of Mathematical Education in Science and Technology, vol. 46, no. 5, pp. 641– 657.
VINNER, S., 1989. The Avoidance of Visual Considerations in Calculus Students. Focus on learning problems in mathematics, vol. 11, no. 2, pp. 149 – 156.
ZIMMERMAN, W., 1991. Visual Thinking in Calculus. In: W. ZIMEMERMAN & S. CUNNINGHAM (Eds.), Visualization in teaching and learning mathematics. Washington, DC: Mathematics Associations of America, pp. 127 – 137.
Dr. Valentina Kostic, Prof.ORCID iD: 0009-0005-7795-5109Academy of Applied Technical and Preschool Studies Nis - Department PirotPirot, SerbiaE-mail: valentina.kostic@akademijanis.edu.rs
Dr. Tanja Sekulic, Senior LecturerORCID iD: 0000-0002-0977-4964Technical College of Applied Sciences in ZrenjaninZrenjanin, SerbiaE-mail: tsekulicvts@gmail.com
>> Изтеглете статията в PDF <<[/emember_protected]