
THE IMPACT OF THE DISRUPTIONS OF THE GLOBAL CHECK POINTS ON THE SEABORNE TRADE
Svetlana DimitrakievaORCID iD: 0000-0001-9639-9957Technical University of Varna, Bulgaria
Ergun GunesChartered Shipbroker, Essex Shipping Services, United Kingdom
Christiana AtanasovaORCID iD: 0000-0003-2102-037XNikola Vaptsarov Naval Academy, Varna, Bulgaria
https://doi.org/10.53656/igc-2024.11

Pages 72-83
Abstract. The paper aims to analyze the impact of meteorological and geopolitical disruptions on the main shipping checkpoints. Globalization is predicated on the free international movement of goods, essential for international trade. Those goods' delivery relies on specific trade routes and checkpoints, which have always been critical passages for the carriage of goods by sea. On the other hand, any disruption at those checkpoints can have detrimental consequences for the global economy. Any disruption can significantly impact global trade, leading to delays, increased shipping costs, and potential shortages of goods. The impact of those disruptions could also create substantial economic damages, as those passages are crucial for planning for the future and will always be a primary global concern. Although the checkpoints provide a lot of economic advantages, their vulnerability and the lack of physical security invariably endanger shipping and international trade.
Keywords: checkpoints; channels; natural disasters; piracy; disruptions; geopolitical conflicts
JEL: A1, F1, R4, L91
- Introduction
Artificial waterways worldwide have revolutionized international shipping by shortening transportation routes and reducing operational costs (Rodrigue, 2016). The Suez Canal in Egypt, for instance, stands as one of the most critical waterways globally, connecting North America, Europe, and the Mediterranean Sea with the Middle East and Asia (Dimitrakiev & Gilev. 2021). It serves as a pivotal transportation channel for a multitude of commodities, including petroleum and natural gas. The Suez Canal is indispensable for maritime navigation.
In this context, the article investigates the impact of the disruptions of the global check points on the seaborne trade. The primary focus of the research centers on the Panama and Suez Canals as paramount global maritime routes.
- Suez and Panama Canals Disruptions
For the fiscal year 2022/2023, ending in June, Egypt's revenue from the canal reached $8.8 billion. Traffic on this key trade route decreased by 30% between January 1 and 11, 2024, compared to the same period the previous year. 544 vessels have passed through the canal since the beginning of 2024, compared to 777 during the same period in 2023.
For March 2024, on an annual basis, revenues from passing ships through the canal have halved. Nonetheless, it should be noted that for the first quarter of 2023, revenues from passing ships set a historical record. The decline in cargo traffic through the Suez Canal is mainly due to the constant attacks by Yemeni Houthi rebels on commercial vessels in the Red Sea. In mid-November 2023, the Houthis announced they would target sites associated with Israel, including commercial ships. A Houthi spokesperson stated that they would obstruct ships traveling to Israel, regardless of their flag.
A combination of climate change and infrastructure issues is responsible for critical delays in maritime traffic through the Panama Canal. Remnants of ancient forests highlight the severity of the situation in the drought-stricken Panama Canal. Just a few hundred meters from the massive ships carrying goods worldwide, dried stumps rise above the waterline. They are all that remains of a forest that was flooded more than a century ago to create the canal. It is not uncommon to see these stumps during the height of the dry season (Carse, 2012). They are a visible reminder of how dry conditions have crippled a waterway that handles $270 billion in goods annually from around the world. There are no easy solutions. The Panama Canal Authority is considering potential solutions, including creating an artificial lake to pump water into the canal and cloud seeding to increase rainfall, but both options would take years to implement, if they are feasible at all.
With water levels standing 1.8 meters below normal, canal authorities are reducing the number of vessels that can transit the canal. Some shippers pay millions of dollars to expedite their place in the growing queue, while others opt for longer and more expensive routes around Africa or South America.
Subsequently, the restrictions have been slightly eased, but with a maximum of 24 ships passing per day, the current limit is well below the pre-drought daily capacity of around 38. As the dry season continues, the situation is likely to worsen again.
The canal's difficulties reflect how climate change is altering global trade flows. Drought is causing problems on the Mississippi River in the U.S. and the Rhine in Europe. In the United Kingdom, rising sea levels increase the risk of flooding along the Thames. Melting ice is creating new maritime routes in the Arctic.
Under normal circumstances, the Panama Canal handles about 3% of global maritime trade volumes and 46% of the containers moving from Northeast Asia to the U.S. East Coast. Transit of vessels through the Panama Canal has decreased by 49% from its maximum, mainly due to falling water levels.
The canal is Panama's largest revenue source, generating $4.3 billion in 2022. According to UNCTAD data, peak shipping was recorded in January 2022, after which transit through the canal gradually decreased (UNCTAD, 2024). The situation is also influenced by the El Niño phenomenon, associated with temperature fluctuations in the surface layer of water in the equatorial part of the Pacific Ocean.
Waiting times, which are usually between three and five days, sometimes extend to 19 days. The Canals Traffic & Congestion tool in AXSInsights from AXSMarine can illustrate these data. It provides daily information obtained from AIS on bulk carriers in the Panama and Suez Canals, as well as their respective waiting areas (Ahmed et al., 2018). The report also allows filtering for specific locations within the canal zones, ship sizes, and their current directions. It also enables comparison of daily traffic and monitoring of percentage changes in movement between Panama and Suez (El Sakty, 2020), as well as rerouting around the Cape of Good Hope (Fig. 1).
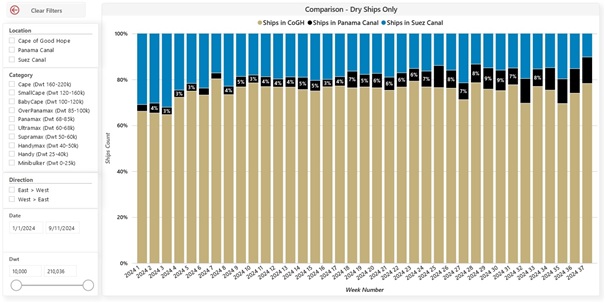
Figure 1. Comparison Cape of Good Hope – Suez CanalSource: AXSMarine reports
- Most Affected Segment of the Global Merchant Fleet Due to Red Sea Crisis
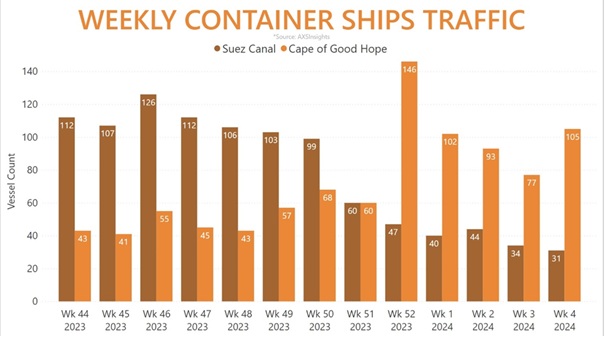
Figure 2. Weekly container ships trafficSource: AXSMarine reportsBulk carriers, which predominantly transport Brazilian iron ore and grain to China via the Cape of Good Hope, appear to be the least affected by the Red Sea crisis. Before the crisis began, fewer than 200 ships from this market segment passed through the Suez Canal weekly, with their number dropping to just over 110 in the last week of January, marking a 42% decrease. Over the past five weeks, the number of ships transiting around the Cape of Good Hope has increased to over 320 per week. Although the container ship segment is the most affected by the Red Sea crisis in weekly percentage terms, the overall number of bulk carriers and tankers rerouted around the Cape of Good Hope is actually higher.
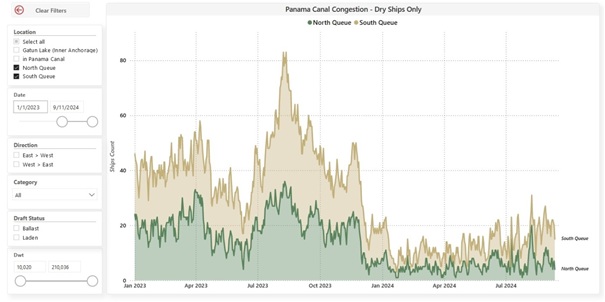
Figure 3. Panama canal congestionSource: AXSMarine reports
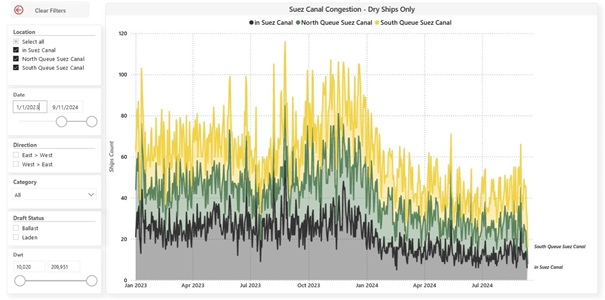
Figure 4. Suez canal congestionSource: AXSMarine reportsWaiting time is a 30-day rolling average and is calculated based on all bulk carriers, both booked and unbooked, waiting at the respective anchorage points to transit through the Panama Canal. Waiting time can vary depending on the size of the ship, whether it is booked or not, and whether it is transiting through the old or new locks of the canal.
Egypt's revenue from the transit of ships through the Suez Canal for the fiscal year 2023/24 (ending June 30) has decreased by 23.4%, Reuters reports, citing a statement from the Canal Authority’s Chairman, Osama Rabie. Revenues from the Suez Canal for the period from July 1, 2023, to June 30, 2024, amount to $7.2 billion, compared to $9.4 billion for the previous fiscal year 2022/23. Meanwhile, the number of ships transiting the canal in the year has decreased from 25,900 (in fiscal year 2022/23) to 20,100 (in fiscal year 2023/24), marking a 22% drop.
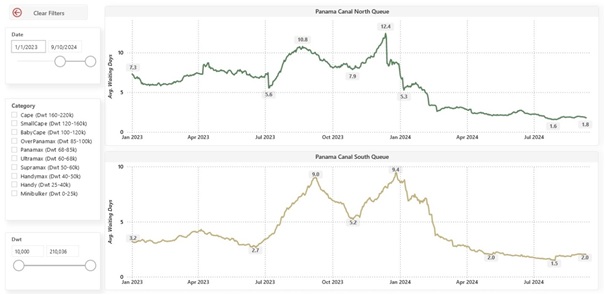
Figure 5. Panama canal wait timeSource: AXSMarine reports
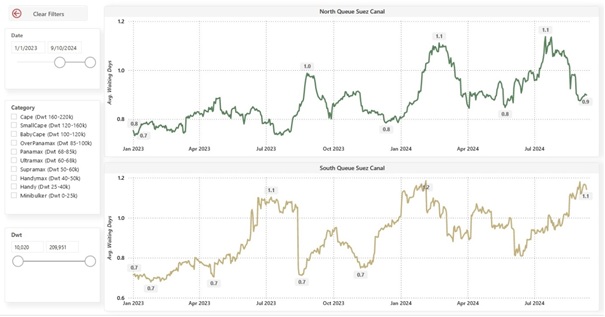
Figure 6. Suez wait timeSource: AXSMarine reportsComparing other periods, the decline in cargo traffic through the Suez Canal is even greater. For the entire calendar year 2023 compared to the previous year, the decrease is 28%. For January of this year compared to the same month in the previous year, revenues have fallen by 47%.
- Voyage Estimation
For greater clarity, we perform calculations for a standard type of ship transiting once through the Suez Canal and another time around the Cape of Good Hope. The distances for the two routes are visualized in Fig. 7 and Fig. 8.
Maritime cargo transportation is a complex process involving many participants from different countries and continents. It is no coincidence that many authors emphasize the need to use tools that adhere to modern techniques, especially those based on technology (Sterev, 2023). In this regard, AXS Marine is a leader in providing innovative solutions that can be effectively used by maritime professionals (Dimitrakiev & Molodchik, 2018; Koritarov, 2021). AXS Marine offers information on current market conditions, routes, and other factors that impact the commercial operation of ships. It also provides analyses and statistics on shipping markets. This is why this comprehensive platform was used for the current calculations.
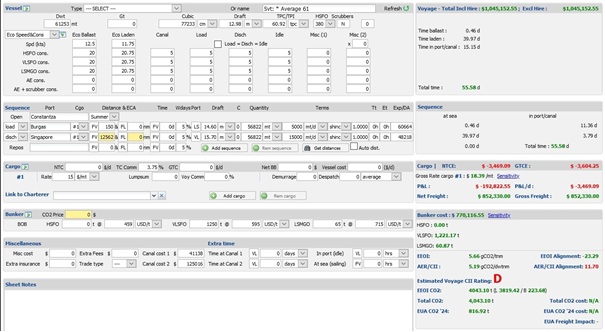
Figure 7. Estimation via Suez CanalSource: AXSMarine reports
Figure 8. Estimation via Cape of Good CopeSource: AXSMarine reportsIt is important to note again that calculating the financial result is a complex task and involves numerous financial factors and variations depending on the specific voyage and conditions. Therefore, maritime professionals and ship managers rely on extensive experience and specialized software tools to perform these calculations accurately and efficiently.
- Conclusions
During the fiscal year 2007 – 2008, the Suez Canal achieved record revenues of $5.113 billion, nearly $1 billion more than in previous years.
It is suggested that shipowners might consider using the Northern Sea Route as an alternative to the transport arteries passing through the Suez and Panama Canals, but this would delay the delivery of goods and increase transport costs (Wang, Zhang & Meng, 2018).
However, it remains a fact that a significant portion of trade between European and South Asian countries is tied to the Suez Canal, along with the associated costs and delivery speed. Therefore, this option will maintain its priority in the near future. The assessment of the medium-term outlook proves that the Suez Canal and the Panama Canal cannot currently be replaced.
REFERENCES
Ahmed, H. Z., Khan, N., Sajjad, S. & Ahmed, D. (2018). Evaluation of Strategic Importance of CPEC: A Comparative Study with Panama Canal Project and Suez Canal Project. Paradigms: A Research Journal of Commerce, Economics, and Social Sciences, 12(1), 128 – 119. https://doi.org/10.24312/paradigms120116
AXSMarine. Trade Flows & AXSInsights. AXSDry modules. https://public.axsmarine.com/axsdry/all-tools
Biolcheva, P. & Valchev, E., (2023). Safety through Artificial Intelligence in the Maritime Industry. Strategies for policy in science and education, 31(3), 270 – 280. https://doi.org/10.53656/str2023-3-3-saf
Carse, A. (2012). Natureas Infrastructure: Making and Managing the Panama Canal Watershed. Social Studies of Science, 42(4), 539 – 563.
Conev, I. & Dimitrakiev, D., (2023). Use of Modern Technologies at Naval Academy Varna. Proceedings of the International Association of Maritime Universities, 129 – 135. http://archive.iamu-edu.org/wp-content/uploads/2023/12/IAMU_Proceedings2023_Finalized_041223.pdf
Dimitrakiev, D. & Gilev, G., (2021). Green Ports – Environmental Challenges and Economic Demands. Pedagogika-Pedagogy, 93(7s), 132-140. https://doi.org/10.53656/ped21-7s.11gree
Dimitrakiev, D. & Molodchik, A.V. (2018). Digital Platforms as Factor Transforming Management Models in Business and Industries. Journal of physics: Conference series, 1015(4), 042040. https://doi.org/10.1088/1742-6596/1015/4/042040
El Sakty, K. G. A. (2020). A Comparison Study Between the Suez Canal and the Panama Canal on the International Container Shipping. Scientific Journal for Financial and Commercial Studies and Researches (SJFCSR), 1(2), 81 – 108.
Gancheva, Y., (2021). Some Problems Related to the Exploitation of Automated Container Rerminals. Pedagogika-Pedagogy, 93(7s), 122-131. https://doi.org/10.53656/ped21-7s.10cont
Koritarov, T., (2021). Application of Virtual Online Techniques in Maritime Education in a Pandemic – New Pedagogical environment and issues. In International Scientific Conference Innovative Education for Emerging Maritime Issues (pp. 63 – 69). Nikola Vaptsarov Naval Academy.
Koritarov, T. & Dimitrakiev, D., (2021). Unmanned Aerial Vehicles in Port Operations – Use Cases and Benefits. In International Scientific Conference Innovative Education for Emerging Maritime Issues (pp. 70-78). Nikola Vaptsarov Naval Academy.
Rodrigue, J.-P. (2016). The Geography of Transport Systems. Taylor & Francis.
Sterev, N., (2023). Pre-Incubation Toolkits for Academic Entrepreneurship Fostering: Bulgarian Case. Strategies for Policy in Science and Education, 31(3s), 90 – 103. https://doi.org/10.53656/str2023-3s
UNCTAD. (2024, February 22). Disruptions in Key Global Shipping Route – Suez Canal, Panama Canal, and Black Sea – Signal Unprecedented Challenges for Global Trade Affecting Millions of People in Every Region, [Press release]. https://unctad.org/press-material/disruptions-key-global-shipping-route-suez-canal-panama-canal-and-black-sea-signal
Wang, H., Zhang, Y. & Meng, Q., (2018). How Will the Opening of the Northern Sea Route Influence the Suez Canal Route? An Empirical Analysis with Discrete Choice Models. Transportation Research: Part A Policy and Practice, 107, 75 – 89.