Изследователска дейност
KEY PERFORMANCE INDICATORS – INPUT, INTERVENING AND OUTPUT VARIABLES
https://doi.org/10.53656/voc23-211keyp
Резюме. In this article, the author argues for an open and transparent use of data that already exists but is not collected, collated and analysed within the education system in Bulgaria. This data needs to become Key Performance Indicators that will drive up:
– the Quality of Education; and
– the Standards of Achievement.
The author focusses on the relationship between:
– Input Variables (Prior Attainment and Delegated Financial Resources);
– Intervening Variables (Patterns of Expenditure) and
– Output Variable (Attendance, Standards of Attainment and Post-school Participation).
With one exception, real data is collated, analysed and presented using a range of algebraic and graphical approaches.
Finally, the author concludes that with greater subsidiarity (i.e., greater delegation of responsibility, authority and accountability); the greater the need for reliable and valid assessment data to hold the education system to account at school, regional and national level.
Ключови думи: education system; Bulgaria; key performance indicators; variables; input; output; intervening
“The system of state education is part of the public sector and uses resources in the form of taxes, forcedly collected from the private sector. Therefore, the effectiveness of the use of funds allocated for education is an extremely important issue for public sector economics.”
C. V. Brown & P. M. Jackson (1991)
Introduction
Data should be publicly available that demonstrate how individual schools and the education system as a whole in Bulgaria are performing. With one exception, the data presented here already exist; however, they are not collected, collated and analysed. There needs to be an open and transparent approach to monitoring and evaluation that translates this data into Key Performance Indicators. These can be quantitative or qualitative:
– quantitative – standards of achievement, pupil destinations;
– qualitative – questionnaires, end-user opinions;
but Key Performance Indicators (KPIs) are the crucial data that will help to drive up:
1. the Quality of Education; and
2. the Standards of Achievement.
This paper concentrates on Quantitative Performance Indicators and uses the approach and techniques borrowed from Black Box and Open System Theories to aid in their interpretation: only passing reference will be made to Qualitative Performance Indicators.
Black box and open system theory
A Black Box is a system that can be analysed in terms of its Input Variables and its Output Variables1 without any knowledge of its internal structure and organisation. In this analysis, only Input Variables and Output Variables are used to infer the structure and organisation of schools and the education system in Bulgaria.
A Black Box was described by Wiener (1961) as an unknown system that is identified using the techniques of system identification. In this case, statistical methods are used to build mathematical models of a school or an education system from measured data. A common approach is to start from measurements of the Input Variables and the Output Variables and to try to determine a mathematical relation between them without going into many details of what is actually happening inside the school or the education system. This approach is known as of Black Box System Identification.
Figure 1
The Open System Theory is the foundation of black box theory. They both focus on Input Variables and Output Variables that represent exchanges with the environment. In Open Systems Theory, the black box is an abstract representation of a concrete open system which can be viewed solely in terms of its Input Variables and Output Variables. The internal structure and organisation of the school or the education system are irrelevant to Open Systems Theory; only the Input Variables and Output Variables are of interest.
Figure 2
The Black Box Approach is based on the "explanatory principle": i.e., the hypothesis that there is a causal relationship between the Input Variables and the Output Variables. This principle states that:
– the Input Variables and Output Variables are distinct;
– the system has observable (and relatable) Input Variables and Output Variables; and – the system is black to the observer (opaque).
Quantitative performance indicators
In this analysis, Quantitative Performance Indicators are treated as Input and Output Variables. They are the critical indicators of progress toward an intended result; therefore, they:
– provide a focus for strategic and operational improvement;
– create an analytical basis for data-led policy formulation; and
– help focus attention on what matters most
– improving the Quality of Education, and
– raising Standards of Achievement.
Leading and managing with the use of KPIs includes setting targets (the desired Standards of Achievement) and tracking progress against that target.
Good Quantitative Performance Indicators:
– provide objective evidence of progress towards achieving a desired result;
– measure what is intended to be measured (Validity) to help inform better decision making;
– can track changes over time;
– can track the efficient and effective use of resources; the quality of teaching, standards of achievement, pupils’ progress and behaviour and governance.
In addition to Input Variables and Output Variables, in the real life of schools and the education system, it is important to introduce the concept of Intervening Variables. This is illustrated in Table 1 and Figure 3. Intervening Variables are usually the outcome of decisions taken by managers that could have an impact on the quality of education or the standards of achievement. Intervening Variables can function as either Input Variables or Output Variables, depending upon the analysis being undertaken. The pupil/teacher ratio, for example, can be:
– an Output Variable in the analysis of Delegated Financial Resources; or
– an Input Variable in the analysis of Standards of Achievement.
Table 1
Figure 3
In the process of establishing an algebraic or geometric relationship between the Variables, it is important to maintain a consistent direction of causality; i.e., don’t get Input and Output Variables mixed up. This is particularly true for Intervening Variables; in a particular analysis it is important to be clear whether the Intervening Variable is functioning as an Input Variable or an Output Variable. This is illustrated, in general terms, in Figure 4; with more specific examples shown in Figure 5.
Figure 4
Figure 5
Input variables (prior attainment data)
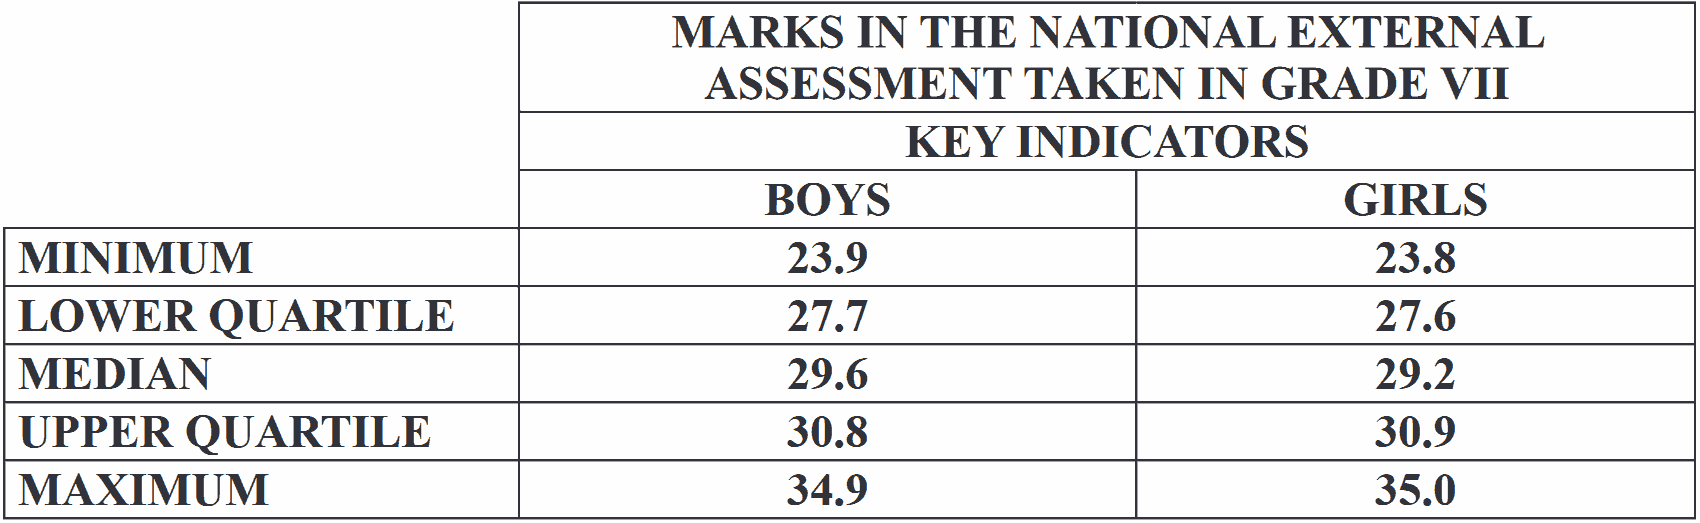
The marks achieved by pupils in the National External Assessment taken at the end of Grade 7 are an important Input Variable – a measure of the Prior Attainmentѝ of pupils entering Grade 8. As an example, Figure 6 illustrates the distribution of marks of all the pupils entering a Mathematics High School. Figure 7, illustrates the same data set broken down into boys and girls. Casual observation indicates that there is little difference in Prior Attainment between the boys and the girls.
Figure 6
Figure 7
This casual observation is reinforced by Table 2 which indicates that the Minimum, the Lower Quartile, the Median, the Upper Quartile and the Maximum of the boys’ and the girls’ marks are not significantly different.
Table 2
Input variables (delegated financial resources)
Prior Attainment Data are, of course, not the only Input Variable. The Delegated Financial Resources that are made available to school directors are another crucial Input Variable, Staribratov, Kunchev and Budgell (2015). Figure 8 illustrates the main components in the scheme of delegation of one municipality:
– Standards per pupil (68%);
– Supplements per pupil (1%);
– Standards per class (15%);
– Standards per school (2%); and
– Supplements per school (14%).
Figure 8 illustrates quite clearly that the Standards per pupil make up by far the biggest component of the Delegated Financial Resources.
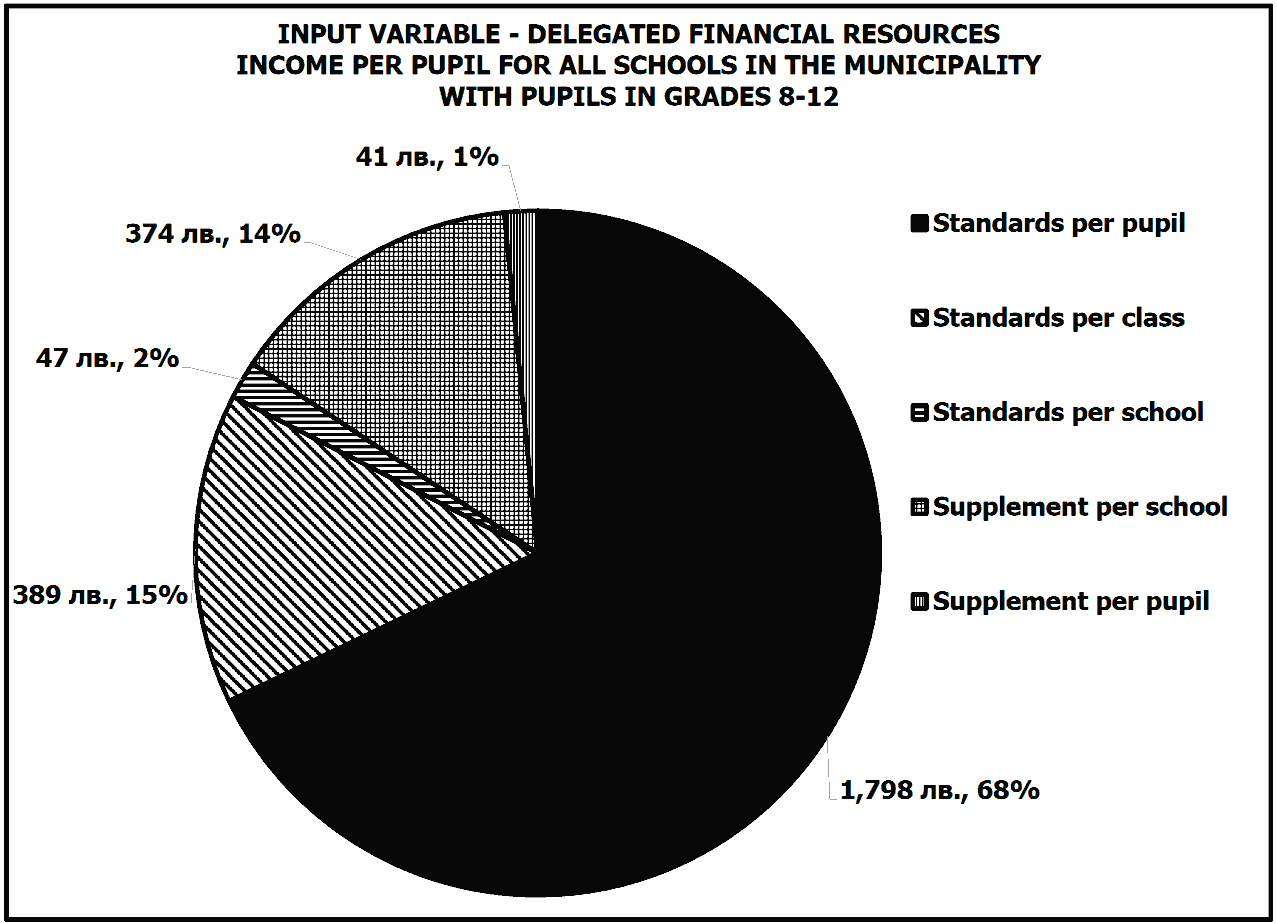
Figure 8
Figure 9, however, illustrates the income per pupil for the individual schools that:
– take secondary aged pupils; and
– are financed and administered by the municipality.
It can be seen from Figure 9 that the Standards per pupil is the same for all schools. However, there are significant differences between the schools in the other components:
– for High School 1, the Standards per pupil component makes up 72.8 % of its income; whereas
– for Community School 6, it makes up only 52.7 %.
Figure 9 prompts some serious questions; for example, why does the Supplements per school component make up only 7.5% of High School 1’s income but as much as 29% of Community School 6’s income? There may be a legitimate reason; for example, Community School 6 may have an antiquated heating system that is very expensive to operate.
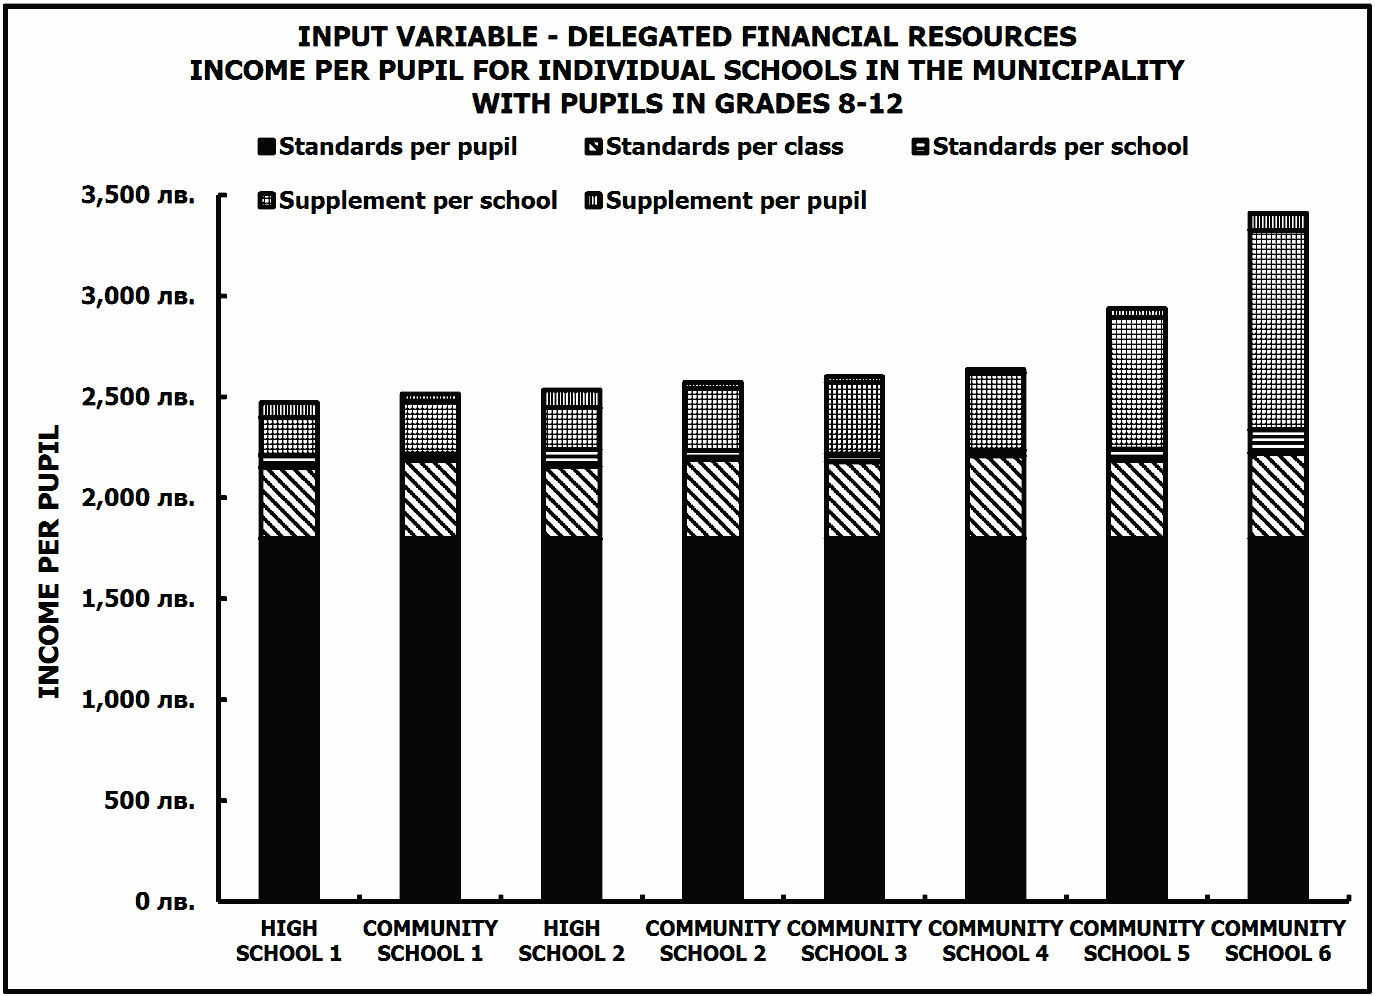
Figure 9
Intervening variables (patterns of expenditure)
Patterns of expenditure:
– teachers’ salaries;
– other personnel salaries;
– premises related costs; and
– supplies and services provide easily available Intervening Variables. Figure 10, for example, illustrates the pattern of expenditure across the Science/mathematics and the Mathematics High Schools in Bulgaria.
Figure 10
If greater depth of analysis is required, it is important that a common strategy is developed in order to provide consistent data: Tables 3 and 42 provide one example of such a strategy. Table 3, illustrates the Curriculum Notation for Grade 10 in a Mathematics High School. It shows:
– the overall curriculum model for Grade 10;
– the total number of pupils (104);
– the number of classes (4);
– the total number of lessons (163);
– the number of lessons for each subject across Sectors A, B and C (e.g., Bulgarian Language and Literature {3A}, English {2A+1B}, Mathematics {2A+2B}, PE and Games {2A+1C});
– the number of Bonus Periods where classes are split (e.g., Information Technology and Informatics).
Table 3
A Curriculum Notation is constructed for each Grade; each of which is linked to Table 4 – the Staff Deployment Analysis – and key information is automatically transferred across (Grade 10 is highlighted):
– the number of pupils (702);
– the number of lessons taught (1126);
– the number of bonus lessons (181);
– the average class size (22).
Table 4
Other information is entered directly into Table 4:
– the full-time-equivalent number of teachers (49);
– the number of persons in the timetable cycle (35);
– the expenditure on teachers’ salaries (914,174lv).
Important Intervening Variables:
– the pupil/teacher ratio (14:1);
– the average percentage contact (66%);
– the average annual cost of one lesson (812lv);
– the annual cost of the bonus lessons (145,950lv)
are then calculated automatically
Output variables (standards of achievement)
Figure 11, illustrates a simple but important Output Variable: the marks for all the pupils in a Mathematics High School in the Secondary School Diploma. Figure 12, illustrates the same data set broken down into boys and girls. Casual observation of this data set indicates that the girls outperform the boys.
Figure 11
Figure 12
This casual observation is similarly reinforced by Table 5 which indicates that the Minimum, the Lower Quartile, the Median, the Upper Quartile of the girls’ marks are higher than those of the boys. The Maximum of the boys’ and the girls’ marks are the same (6.0); but that is because 6.0 is the maximum possible score. As Table 2 indicates that there is no significant difference between the boys’ and girls’ Prior Attainment Scores (the Input Variable). Taken together, therefore, Tables 2 and 5 indicate that the girls make more progress than the boys in their time at the school.
Table 5
Figure 13, illustrates an alternative Output Variable, the marks in the Bulgarian Language and Literature Matura for the same pupils at the same Mathematics High School. Generally speaking, Figure 13 presents the same shape distribution as Figure 11. However, as those marks in the Bulgarian Language and Literature Matura are such an important element in the algorithm that calculates the marks in the Secondary School Diploma, this should not be too surprising.
Figure 13
Figure 14, illustrates the average marks in the Mathematics Matura for all of the Mathematics/science and Mathematics High Schools in Bulgaria. The lack of any Input Variable (Prior Attainment Scores) makes it impossible to draw any conclusions about the Quality of Education or the Standards of Achievement across the schools. Despite the difference in the Output Variable (the marks in the Mathematics Matura), it is not possible to conclude that School 32 (5.69) is a better school than School 1 (4.15) without significantly more information about:
– the Prior Attainment and Ability Distribution of the pupils who attended the school; and
– which pupils elected to study for the Mathematics Matura – School 1 (5 pupils) and School 32 (158 pupils).
Figure 14 does however raise one important question. Given that School 1 is a Mathematics High School, why did so few pupils choose to study for the Mathematics Matura?
Figure 14
Input variables output variables (prior attainment standards of achievement)
In the previous section, it was stressed that the lack of any Input Variables (Prior Attainment Scores) made it impossible to draw any conclusions about the Quality of Education or the Standards of Achievement from Output Variables alone. Figure 15 illustrates an Input Variable (the National External Assessment taken in Grade 7) and an Output Variable (the Secondary School Diploma) for the same pupils at a Mathematics High School, (Kunchev and Budgell 2014). Because the marks have a totally different range and distribution:
– 23.84 35.00 in the National External Assessment; and
– 4.60 6.00 in the Secondary School Diploma;
they have been expressed as a percentage of the maximum possible mark in order to make them comparable.
Figure 15
It is immediately obvious from Figure 15, that the distributions have a completely different shape. This is reinforced by Table 6, a far greater number of pupils are awarded high marks in the Secondary School Diploma than achieve high marks in the National External Assessment.
Table 6
A school director might immediately want to conclude that Figure 15 and Table 6 demonstrate what a good job the school is doing! There are, however, more compelling interpretations.
1. There is an artificial ceiling in the assessment processes that make up the Secondary School Diploma. Good pupils can be awarded top grades and, therefore, the Diploma does not distinguish between good pupils and excellent pupils.
2. Unmoderated teacher assessments are significant elements of the algorithm that calculate the Secondary School Diploma. These unmoderated assessments, together with the pressure on the teachers to grade the pupils as high as possible, lead to the unreliable over-assessment of the pupils’ standards of achievement.
Figures 16 and 17, illustrate two methods of presenting the same data set:
– the Marks in the National Assessment taken in Grade 7; and
– the Teacher Assessment of the standards attained by the pupils in Bulgarian Language and Literature at the end of Grade 12.
Figure 16, presents the data as a scatter graph; including the equation of the ‘regression line’ ( and a measure of how close the data are to the fitted regression line R2 (0.2938). These measures indicate that, although there is a relationship between the Marks in the National Assessment and the Teacher Assessment of the Standards attained by the pupils in Bulgarian Language and Literature, it is not a particularly strong relationship. This conclusion is reinforced by the highlighted data points which indicate that:
– pupils with marks between 23 and 26 in the National External Assessment can be awarded marks from 3.00 to 5.75 by their teachers in Bulgarian Language and Literature;
Figure 16
– those with marks between 27 and 28 can be awarded marks between 3.25 and 6.00; and
– those with marks between 30 and 31 can be awarded marks between 3.75 and 6.00.
Figure 17, presents the same data as a ‘Box and Whisker Plot’ which illustrates the minimum, lower quartile, median, upper quartile and maximum for each subset of the data.
Figure 18, is comprised of simulated data: it presents the data as a scatter graph; including the equation of the ‘regression line’ ( ) and a measure of how close the data are to the fitted regression line R 2 (0.7725). These measures indicate that not only is there a relationship between the Marks in the National Assessment and the Marks in the Secondary School Diploma, it is a strong relationship: the National Assessment dada account for over 75% of all the variability of the Secondary School Diploma data. This sort of analysis that expresses the Output Variable as a function of the Input Variable should be very important in assessing the Standards of Achievement in a group of similar schools like the Mathematics/science and Mathematics High Schools.
Figure 17
6.0
5.5
Figure 18
Output variables output variables (teacher assessment grades examination grades)
It has already been pointed out that unmoderated teacher assessments are significant elements of the algorithm that calculates the marks in the Secondary School Diploma and can lead to an unreliable over-assessment of the pupils’ Standards of Achievement. Figures 19, 20 and 21 examine this issue further. Figure 19, presents a histogram illustrating:
1. the marks awarded by the teachers (Mean = 5.05); and
2. the marks gained in the Matura (Mean = 5.26) in Bulgarian Language and Literature for the pupils in a Mathematics High School.
Figure 19
Figure 20, takes the same raw data and presents it as a scatter graph: including the equation of the ‘regression line’ ( and a measure of how close the data are to the fitted regression line R2 (0.4027). These measures indicate that, although there is a relationship between:
– the Teachers’ Assessment of the Standards attained by the pupils; and
– the Marks gained in the Matura in Bulgarian Language and Literature, it is not a strong relationship. This conclusion is reinforced by the highlighted data points in Figure 20 which indicate that:
– pupils with marks awarded by their teachers of between 3.25 and 3.50, gain marks of between 3.31 and 5.43 in the Matura;
– those with a mark awarded by their teachers of 4.75, gain marks between 4.21 and 5.85 in the Matura; and
– those with a mark awarded by their teachers of 6.00, gain marks between 4.70 and 6.00 in the Matura.
Figure 20
Figure 21, presents the same data as a ‘Box and Whisker Plot’ which illustrates the minimum, lower quartile, median, upper quartile and maximum for each subset of the data and reinforces the conclusion that there is not a strong relationship between teacher assessment and final examination grades.
All forms of assessment are beset by problems of Reliability and Validity.
– The Reliability of a test is a measure of its consistency:
– if the pupil took the test the next day would they get the same result, or
– if the test was marked by a different examiner would the pupil get the same result:
– The Validity of a test is a measure of its accuracy;
– does the test really assess the pupils’ knowledge, skills and understanding of the content specified in the curriculum?
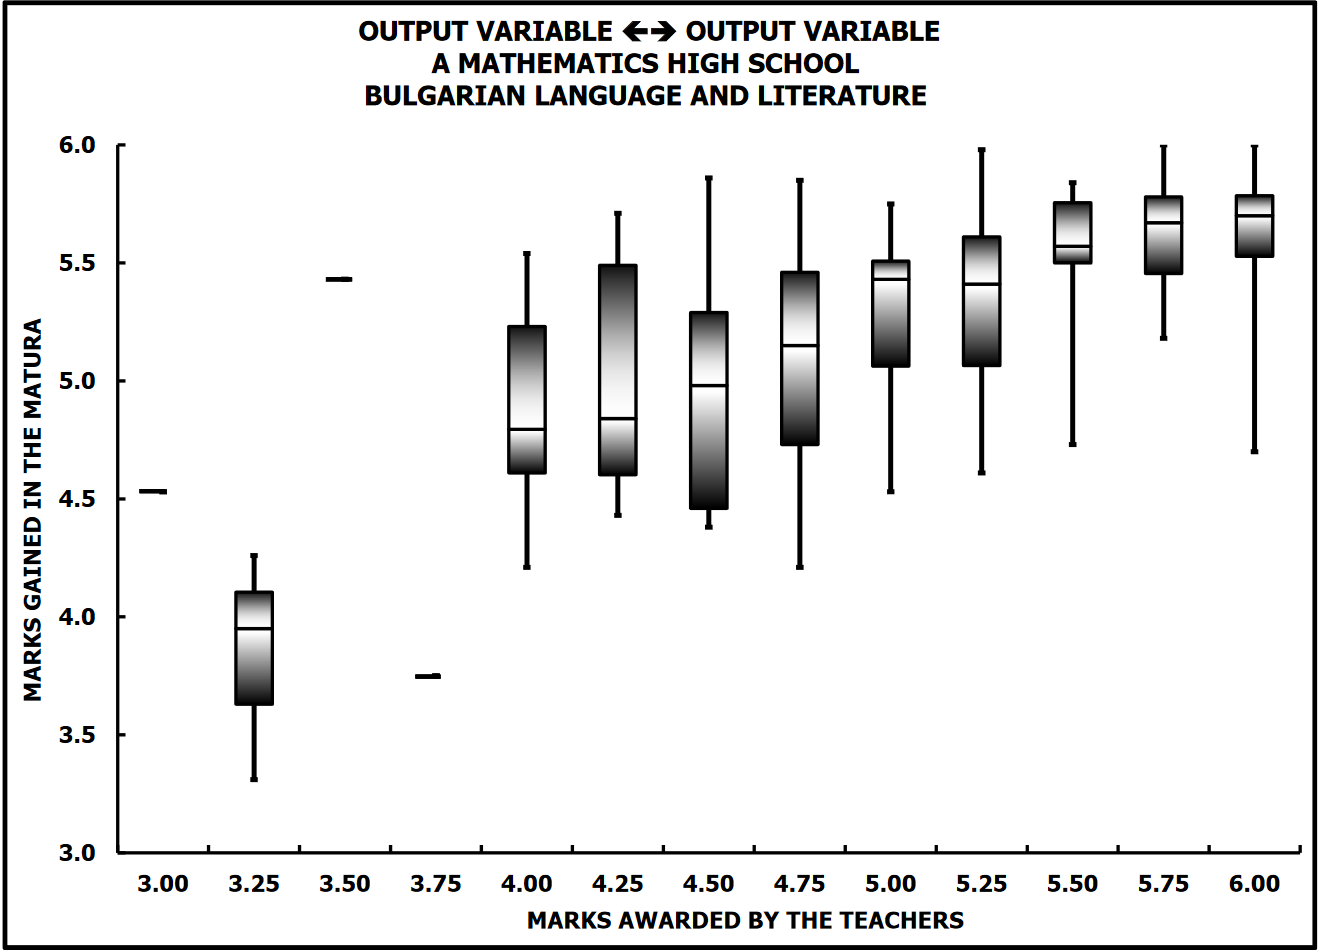
Figure 21
When applied to the data in Figures 19, 20 and 21, there are (at least) two possible explanations.
1. As a single examination, the Matura can only assess part of the Bulgarian Language and Literature curriculum. In that sense, it may not be a valid assessment of the pupils’ knowledge, skills and understanding of the whole curriculum. It may however be a more reliable assessment.
2. The teacher assessment may have more validity, in that the teachers are basing their judgements on a broader spectrum of work submitted by the pupils across Grade 12. However, the lack of any internal or external moderation, does mean that reliability could be an issue.
Output variables output variables output variables
(attendance diploma grades post school participation)
Budgell (2021) first published the flow chart reproduced here as Table 7. This illustrates the relationship between three Output Variables:
1. attendance at school;
2. marks in the Secondary School Diploma; and
3. post school participation; what the pupils did after school.
In this flow chart, each of the Performance Indicators (Output Variables) is divided into four levels of achievement, the thickness of the lines being proportional to the percentage of pupils. For example, therefore, of the pupils who attended school more than 90% of the time in Grade 12:
– 67% were awarded marks of greater than 5.50 in the Secondary School Diploma and went on to university or college;
– 22% were awarded marks between 5.00 and 5.50 and went into employment with training; and
– 11% were awarded marks between 4.00 and 5.00 and went into basic employment without any formal training.
On the other hand, pupils with less than 50% attendance were awarded marks of less than 4.00 in the Secondary School Diploma and one year after leaving school were still unemployed.
Table 7
Qualitative performance indicators
Typically, a Qualitative Performance Indicator is a characteristic of a process or decision taken in the school. Examples of qualitative KPIs include opinions, judgements or properties. Qualitative indicators that schools regularly use are:
– a survey of pupil satisfaction;
– a survey of parental attitudes;
– the attitudes of teachers to changes that are proposed;
– the quality of Leadership and Management;
– the quality of teaching; and
– the quality of provision for pupils with additional educational needs.
Although the measures themselves are qualitative, they can be expressed as quantitative data:
– less than 25% of past pupils enjoyed their time at school;
– over 80% of parents surveyed thought that the teachers really knew their children;
– over 90% of the teachers did not want the school to close;
– the majority of School Directors disapproved of the proposed changes;
– 75% of the pupils thought that the majority of teaching was dull and repetitive; and
– all of the parents surveyed believed that the school made no effective provision for pupils with additional educational needs.
Discussion
Throughout this article, it has been stressed that the prime purpose of collecting, collating and analysing data is to drive up:
1. the Quality of Education; and
2. the Standards of Achievement.
Budgell and Kunchev (2019) pointed out that:
education is ultimately for the benefit of the pupil and the quality of the education system depends on delegating agency and choice to the level which is closest to the pupil;
it is the State’s responsibility to determine the structure and organisation of the education system and the levels to which:
– agency and choice; and
– rights and responsibilities should be delegated;
the quality of school leadership is fundamental to:
– improving the Quality of Education; and
– raising Standards of Achievement;
summative assessment undertaken at the end of school provides important data on the pupils’ Standards of Achievement;
reliable and valid summative assessment, if it is analyzed and presented effectively, provides important information about:
– the Quality of Education in the school;
with increasing subsidiarity (i.e., greater delegation of responsibility, authority and accountability) there is a greater the need for:
– reliable and valid assessment data to hold Leadership Teams to account (Kunchev and Budgell 2014);
similarly, with increasing subsidiarity, there is a greater the need for a system of school inspection that focusses on:
– improving the Quality of Achievement; and
– raising Standards of Achievement,
rather than compliance.
NOTES
1. A system where the inner structure and organisation are available for inspection is commonly referred to as a white box.
2. Of course, they also provide an Output Variable for primary schools – an indicator of standards of achievement reached by the pupils leaving Grade 7.
3. Analyses like that provided in Tables 3 and 4 will be of increasing importance as greater power and responsibility are delegated to school directors and they will need to be more publicly accountable.
REFERENCES
BROWN, C. V. and JACKSON, P. M., 1991. Public Sector Economics; 4th Edition. Jackson Wiley-Jackson.
BUDGELL, P., 2021. Alternative Approaches to Vocational Education and Training. Vocational Education, vol. 23, no 1, pp. 9 – 29.
BUDGELL, P. and KUNCHEV, M., 2019. General Theory of Education, Annual Professional Development Meeting for Teachers and Principals. Plovdiv: America for Bulgaria Foundation.
KUNCHEV, M. and BUDGELL, P., 2014. Analysis of the Results of the Educational Process and the Management of the School. In: 43-th Spring Conference of the Union of Bulgarian Mathematicians “Mathematics and mathematical Education”. ISSN 1313-3330.
STARIBRATOV, I.; KUNCHEV, M. & BUDGELL, P., 2015. The System of Delegated Budgets in Secondary Education – Fairness and Predictability. Strategies for Policy in Science and Education, no 5.
WIENER, N., 1961. Cybernetics: or the Control and Communication in the Animal and the Machine. MIT Press.