Учебен експеримент в природните науки
SYNTHESIS, CHARACTERISATION, MOLECULAR MODELING AND BIOLOGICAL STUDIES OF Cо(II) , Ni(II) , Cu(II) AND Zn(II) COMPLEXES OF AZODYE LIGAND DERIVED FROM 4-AMINOANTIPYRINE AND 5-BROMOSALICYLALDEHYDE
Резюме. A new azo dye ligand from 4-aminoantipyrine and 5-bromosalicylaldehyde that is 4-(2’-hydroxy-3’-formyl-5’-bromophenylazo)antipyrine and its Co(II), Ni(II), Cu(II) and Zn(II) complexes have been synthesized. The ligand and its metal complexes have been characterized by various techniques like analytical, IR, NMR, electronic, magnetic susceptibility, thermal, XRD and molecular modeling study. The spectral and analytical study predicts tridentate nature of the ligand, distorted octahedral geometry for Co(II), Ni(II) and Cu(II) complexes and distorted tetrahedral geometry for Zn(II) complex. The Computational study of the ligand and its metal complexes predicts global reactive descriptors and geometrical parameters. The thermal study of the Ni(II) complex reveals its thermal stability and fluorescence study of the ligand and its Zn(II) complex indicates their photo conducting properties. The XRD study of the Cu(II) complex reveals tetragonal crystal system for the complex. The investing compounds are potential bactericides as indicated from their antibacterial study and DNA binding study of the compounds indicates their DNA binding ability.
Ключови думи: azo dye, complex compounds, Gaussian 03 software, XRD study, SEM image
Introduction
Azo compounds are the largest group of synthesized organic compounds due to their versatile applications in various fields like pharmaceuticals, leather, paper and food stuff industries and analytical reagents for various metal ions (Tao et al.,1999; Navarro & Sanz, 1999; Gong et al., 2002; Chohan et al., 2010). Azo dyes containing heterocyclic rings have known for dyeing hydrophobic textile materials like polyamide and polyester (Hallas & Choi, 1999). Heterocyclic dispersed azo dyes are also used by electronic industries as sensors, non-linear optical devices, liquid crystalline devices (Sujiki et al.,1999). Metal compounds with azo dye ligands are gaining importance in recent years due to their applications in areas like pharmaceuticals, biological, analytical. 4-aminoantipyrine is said to have analgesic, antipyretic properties and its metal complexes with Pt(II) and Co(II) have shown the property of anticancer agent (Ayesha et al., 2013). Schiff base metal complexes derived from salicyl aldehyde can cleave the DNA (Routier et al.,1996) and Schiff base derived from 5-bromosalicylaldehyde and 2-aminomethylthiophene and its Co(II), Ni(II), Cu(II) and Zn(II) are exhibiting antibacterial and cytotoxicity properties (El-Sherif & Eldebss, 2011). These observations prompted us to synthesize azodye ligand from 4-aminoantipyrine and 5-bromosalicelaldehyde and a series of metal complexes of Co(II), Ni(II), Cu(II) and Zn(II), characterize using various physico-analytical techniques and evaluate various biological activities.
Materials and methods
All the solvents, the metal salts and other chemicals used are of either analytical grade or high purity supplied by Merck and BDH. Doubly distilled water is used in all experiments.
Elemental analysis (C, H, N) was carried out on Perkin Elmer 240 C elemental analyser and Chlorine contents was determined gravimetrically. Metal estimations are made by standard procedures, conductivity measurements are carried out at 250C in freshly prepared 10-3M solution using PW9526 digital conductivity meter, Magnetic susceptibility of the complexes is measured by Guoy,s balance using Hg[Co(NCS) 4 ] as a calibrant at room temperature and diamagnetic correction have been made by pascal’s constants, IR spectra of the ligand and metal complexes are recorded on using KBr pellets by perkin elmer FT- IR spectrometer within the range 4000- 450 cm-1, UV-Visible spectra of the complexes are collected using a THERMO SPECTRONIC 6 HEXIOS α and fluorescence spectra are recorded in a Fluorescence spectrometer, 1H NMR spectra of the ligand and the Zn(II) complex are obtained from Bruker AV III 500 MHZ FT NMR spectrometer using TMS as reference, ESR spectrum of the Cu(II) complex is recorded on JES-FA 200 ESR spectrometer , mass spectra of the ligand and its complexes are recorded through JEOL GC Mate GC-MS Mass Spectrometer, thermal study of the metal complex is done by NETZSCH STA 449 F3 JUPITOR, SEM image of the complexes are taken in JES FA 200, the XRD powder pattern of the Cu(II) complex is collected using a Philips X’Pert Pro diffractometer.
Computational study
Molecular modeling is now considered as a important tool for calculating certain physic-chemical and geometrical parameters of the chemical compounds. In order to get the better picture about reactivity and geometrical parameters, computational study of the ligand and the metal complexes are performed by Gaussian 03 software package (Frish et al., 2003). The molecular geometry of the ligand and its complexes are fully optimised using B3LYP level of theory along with 6-331G(d,p) basis set. The B3LYP provides better results than the Hartree-Fock method and reproduce better geometrical parameters comparable to the experimental values.
Biological activity
The DNA binding study of the azo compounds is made by Gel electrophoresis method (Maiti et al., 2009). 10 µL of the metal complexes are taken along with 15 µL of CT DNA solution dissolved in Tris-EDTA in centrifuge tubes. The tubes are incubated at 37 for 1 hour. After incubation, the tubes containg solution are kept in a refrigerator at 0 for few minutes, 5 µL gel loading buffer with tracking dye (0.25% bromo phenol) is taken in the tubes for electrophoresis. The electrophoresis is continued under constant voltage (50 V) and photographed under UV illumination.
Hydrodynamic volume change (Abdel-Rahman, 2013) is observed by Ostwald viscometer immersed in a thermostatic bath maintained at 37 . A digital stopwatch is used to measure the flow time, mixing of complexes under investigation with CT-DNA is carried out by bubbling nitrogen. Data are presented by plotting a graph indicating (ɳ/ɳ0) 1/3 verses [complex]/[DNA] where ɳ is the viscosity of DNA in presence of complexes and ɳ0 represents the viscosity of DNA alone. Viscosity values are collected by following the equation ɳ =t-t0 where t is the flow time of the DNA containing solutions and t0 is the flow time of DNA alone.
The antibacterial activity of the ligand and its metal complexes is studied in vitro by the cup-plate method against the Escherichia coli (MTCC-40) and Staphylococcus aureus (MTCC-87) using agar nutrient as the medium by the cup plate method. The investigated ligand and its complexes are dissolved in DMF. The sterilised agar plates are swabbed with the bacteria culture and filled with test solutions, then incubated at 37 for 24 hours. The activity is evaluated by measuring the zone of inhibition with respect to the standard drug tetracycline.
Synthesis of ligand
The ligand 4-(2’-hydroxy-3’-formyl-5’-bromophenylazo) antipyrine is synthesized by the coupling reaction between the diazonium chloride produced from 4-aminoantipyrine and alkaline solution 5-bromosalicylaldehyde. This is achieved by diazotization of 4-aminoantipyrine by dissolving 0.01M, 2.03 gram of it in hydrochloric acid, cooling it to 0-50C and adding equivalent amount of ice cooled sodium nitrite solution with stirring. The cooled diazonium chloride is then made to react with the alkaline solution of 5-bromosalicylaldehyde (0.01 M, 2.0 gram). The colored azo dye ligand is formed which is recrystallised from ethanol. This is represented in Scheme 1.
Scheme 1. Synthesis of the ligand
Scheme 2. Synthesis of the ligand
Synthesis of metal complexes
The Metal (Co(II), Ni(II), Cu(II) and Zn(II)) chlorides (0.01 mol) in ethanolic solution are added to the ethanolic solution of the ligand (0.01 mol) separately. The reaction mixtures are refluxed for about for about one hour and allowed to cool, then concentrated ammonia solution is added drop by drop till the formation of to get the precipitate of Co(II), Ni(II), Cu(II) and Zn(II) metal complexes. The metal complexes as given in Figs 1-2 are collected by filtration, recrystallised from ethanol and dried in vacuum. This is represented in Scheme 2.
Fig. 1. Structure of Co(II) complex
Fig. 2. Structure of Zn(II) complex
Results and discussion
The ligand and all its metal complexes are coloured and stable to air. The complex compounds are soluble in solvents like DMF and DMSO but remain insoluble in alcohol, ether and acetone. The high melting point of all complexes from the melting point of ligand indicates more thermal stability of the complexes than the ligand.
Elemental analysis
The elemental analysis of the compounds given in Table 1 is in good agreement with the composition of the suggested formula. The analytical data of the complexes indicate that their formulas as \(\left[\mathrm{M}_{2} \mathrm{LCl}_{3}\left(\mathrm{H}_{2} \mathrm{O}\right)_{5}\right]\), where M represents \(\mathrm{Co}(\mathrm{II})\), \(\mathrm{Ni}(\mathrm{II})\) and \(\mathrm{Cu}(\mathrm{II})\), L stands for the ligand ions and \(\left[\mathrm{M}_{2} \mathrm{LCl}_{3}\left(\mathrm{H}_{2} \mathrm{O}\right)\right]\) for \(\mathrm{Zn}(\mathrm{II})\) complex.
Conductance measurements
The Conductance measurements of the solutions of the metal complexes (\(10^{-3} \mathrm{M}\) in DMF) show the value in the range of \(22.43-29.56 \mathrm{Ohm}^{-1} \mathrm{~cm}^{2} \mathrm{~mol}^{-1}\). These values suggest that all metal complexes are non-electrolyte in nature (Geary, 1971).
Table 1. Analytical data of the ligand and its metal complexes
1.LH, 2.[Co2LCl3(H2O) 5], 3.[Ni2LCl3(H2O) 5], 4.[Cu2LCl3(H2O) 5],5. [Zn2LCl3(H2O)]
Spectral study
IR Spectra and mode of bonding
The spectrum of the azo dye ligand as given in Graph 1 is compared with spectra of the complexes as shown in Graph 2 in order to know the mode of bonding of the ligand with the metal ions (Table 2). The spectrum of the ligand shows a broad peak at 3450 cm-1 which is missing from the spectra of the metal complexes that indicates deprotonation of phenolic (OH) group present in the ligand after complex formation with the metal ions. This finding is further supported by the shift in the vibration frequency of ν(C-O) observed at 1209 cm-1 in the ligand to ~1170 cm-1 in metal complexes due to formation of bond of the oxygen atom of phenolic (OH) with the metal ions (Saxena & Tandon, 1984). The spectrum of the ligand shows a band at 1674 cm-1 due to the vibration of (-CHO) group which is shifted to 1625 cm-1 that suggests coordination of carbonyl oxygen atom with the metal ions (Robinson & Uttley,1973). The band at 1467 cm-1 in the ligand corresponds to the vibration frequency of (N=N) which is shifted to ~ 1456 cm-1 in metal complexes, this indicates bonding of one of the azo nitrogen atoms with the metal ions. The spectra of complexes reveal the presence of band at ~3318 cm-1 due to the vibration frequency of O-H of coordinated/ lattice held water. The presence of coordinated water is further confirmed by the rocking band at ~ 870 cm-1 and twisting band at ~ 780 cm-1 (Stefov et al., 2004). The vibrational frequencies of M-O and M-N bonds which appear at ~ 578 cm-1 and ~ 492 cm-1 respectively confirm the bonding between metal ions with the ligand through phenolic oxygen and azo nitrogen atoms (Nakamato, 2009).
Graph 1. IR spectrum of the ligand
Graph 2. IR spectrum of the Co(II) complex
Table 2. IR data of the investigating compounds
1 LH, 2 Co(II) complex, 3 Ni(II)complex, 4 Cu(II) complex and 5 Zn(II) complex
Table 3. Electronic data of the metal complexes
1 Co(II) complex, 2 Ni(II)complex, 3 Cu(II) complex.
Graph 3. Electronic spectra of Co(II) complex-series 1, Ni(II) complex-series 2
Electronic spectra and magnetic moment
The electronic spectra and magnetic measurements are taken in to account to establish the geometric structures of the complexes since I failed to synthesize single crystal of all the complexes given in the Graph 3. The electronic spectrum of the Co(II) complex of the ligand as given in the Table 3 exhibits three weak bands at 12650 cm-1,16528 cm-1 and 22220 cm-1 corresponding to 4T1g(F) 4T2g(F) ( ν1) , 4T1g(F) 4A2g(F)(ν2) , 4T1g(F) 4T 2g(P)(ν 3) transitions which are characteristic of octahedral geometry (Lever, 1968).
Similarly, Ni(II) complex shows three weak bands at assignable to 13171 cm-1, 16260 cm-1, 24691 cm -1 relating to 3A2g(F) 3T2g(F), 3A2g(F) 3T 1g(F), 3A2g(F) 3T1g(P) which is characteristic of octahedral geometry(Shakir et al., 1996). The other electronic parameters for both the complexes calculated by following this equation are summarized in the table which are supporting covalent bonding in metal complexes. The equations for the Co(II) complex are:
\[ \begin{gathered} \mathrm{Dq}=v_{2}-v_{1} / 10 \\ B=v_{2}+v_{3}-3 v_{1} / 15 \\ \beta_{35}=\mathrm{B} / 971 \\ \beta_{35}\%=\left(1-\beta_{35}\right) 100 \end{gathered} \] and equations for Ni(II) complex are:
\[ \begin{gathered} \mathrm{Dq}=v_{1} / 10 \\ B=v_{2}+v_{3}-3 v_{1} / 15 \\ \beta_{35}=\mathrm{B} / 1041 \\ \beta_{35} \%=\left(1-\beta_{35}\right) 100 \end{gathered} \]
The Cu(II) complex shows a broad peak in the range 13350 cm-1 to 17260 cm-1 with a maximum at 15260 cm-1, the broadness of the is due to tetragonal distortion of the metal complex v (Dholakiya & Patel, 2002).
The magnetic moment of the Co(II), Ni(II) and Cu(II) complexes are found to be 1.42 B.M., 1.38 B.M. and 0.92 B.M. respectively in place of 3.87 B.M., 2.83 B.M. and 1.73 B.M. magnetic moment expected from a octahedral geometry. This sub-normality in magnetic moment of the investigating complexes may be due to super exchange through (M-O-M) (Yamada, 1966; Lever & Solomon, 2014). The Zn(II) complex is found to be diamagnetic, hence tetrahedral geometry may be suggested based on the spectral and analytical data. ESR spectral study
The esr spectrum of the Cu(II) complex is recorded at X-band at room temperature. The room temperature solid state of the Cu(II) spectrum given Graph 4 exhibits an axially symmetric g-tensor having gII value 2.11 and g└ value 2.04. These value indicate that the ground state of Cu(II) is predominantly dx2-y2 and Cu2+ ion being located in distorted octahedral site elongated along the Z axis (Aljahdalia et al., 2013). This is confirmed by the electronic spectrum and XRD (powder pattern) study. From the value of gII and g└, the value of G can be deduced by using the relation G= gII- 2/ g└-2 and it is found to be 2.75 which indicates there is exchange interaction between the Cu2+ centre in the solid state (Hathaway & Billing, 1970). The gav value of the complex is calculated as 2.07 by using the relationThe spin-orbit coupling constant is also calculated by using the equation and it is found to be -534.1 cm-1.This value is found to be less than the free ion value (-830 cm-1) that indicates overlapping of metal-ligand orbitals (Dutta & Shymal, 2016). The covalent bonding between metal ion and orbitals of the ligand is also confirmed from the gII value. According to Kivelson & Neiman (1970) covalent bonding can be predicted for a Cu(II) complex with gII value less than 2.3. Hence, distorted octahedral geometry may be proposed for the Cu(II) complex, electronic study of the complex also supports this geometry.
Graph 4. ESR spectrum of Cu(II) complex
Graph 5. 1H NMR spectrum of the ligand
Graph 6. 1H NMR spectrum of the Zn(II) complex
1H NMR spectra
The NMR spectra of the ligand as given the Graph 5 and its Zn(II) complex as given in the Graph 6 are recorded in DMF-d6 solvent. The spectrum of the ligand shows multiplet at δ 5.66-8.13 ppm corresponding to aromatic protons. The spectrum also shows a peak at δ 12.63 ppm which may be assigned to aldehydic protons. Two peaks observed at δ 10.19 ppm and δ 12.91 ppm indicates the presence of phenolic protons (William & Fleming, 1994).
The spectrum of Zn(II) complex of the ligand shows no peaks at δ 10.19 ppm and 12.91 ppm that indicates deprotonation of phenolic groups and coordination of the phenolic oxygen atoms with the metal ions during the formation of the complex compounds. The deprotonation of phenolic groups is also supported by the data provided by the IR study. However, the peaks due to aldehydic proton at δ 12.63 ppm is shifted to 12.84 ppm in the spectrum of complex which suggest bonding of aldehydic oxygen atom with the Zn(II) ion.
Mass spectra
The mass spectra of the ligand and its Ni(II) complex are recorded to get information about structures of investigating compounds. The mass spectrum of the ligand given in the shows a molecular ion peak at 415.2480 m/z that confirms the molecular formula of the ligand as C18H15 BrN4O3. The Ni(II) complex depicts the molecular ion peak with 10% abundance at 733.8401 m/z corresponding to the molecular formula of the complex as [M2LCl3(H2O) 5]. The mass spectra of the ligand and its Ni(II) complex are given in the Graph 7 and Graph 8, respectively.
Graph 7. Mass spectrum of the ligand
Graph 8. Mass spectrum of the Ni(II) complex
XRD study
The XRD study of the Co(II) complex is made to determine its lattice parameters and crystal system. The X- ray powder diffraction pattern given in the Graph 9 and Table 4 is collected from the X’Pert diffractometer and the recording conditions are 40 kv and 40 mA for CuKα with λ= 1.542Å between 200 to 800 with a step size of 0.00890.
Graph 9. XRD pattern of the Cu(II) complex
Table 4. XRD data of the Cu(II) complex
The XRD powder pattern is processed in X’pert high score software package. The search matching procedure is adopted for the PXRD pattern for the Cu(II) complex and revealed a match with a copper compound corresponding JCPDS powder diffraction file with PDF No 250262. The pattern can be indexed to be a tetragonal crystal system with a = b = 7.580, c = 9.950, α = β = γ = 90, lattice = primitive and space group is p42 /mnm (139).
Thermogravimetric analysis
The Ni(II) complex is subjected to thermogravimetric study as a representative example to examine the thermal stability of the metal complexes. The thermogravimetric study of the complex is carried out through the simultaneous TG, DTA and DSC techniques with the heating rate of 10 per minute as given in the Graph 10 and Graph 11 in an atmosphere of nitrogen from ambient temperature to 1400. The complex compound remained unchanged up to 200 and it suffered a mass loss of 9.32 % (calcd 9.50 %) between the temperatures 250 to 350 with inflection at 316.7 corresponding to the loss of coordinated H2O molecules. This is supported by an endothermic peak at 321. Further, the compound suffered a massive mass loss of 42.05 % (calcd 42.15) with inflection at 621.6 between 450due to the loss of ligand moiety and three chlorine atoms. Thus the compound suffered a total mass loss of 63.20 % up to 1400 leaving NiO as the residue.
Graph 10. TG/DTA graph of Ni(II) complex
Graph 11. DSC graph of Ni(II) complex
Fluorescence study
The fluorescence study of the ligand and its Cu(II) complex is undertaken to examine the fluorescence nature of the investigating compounds. The emission spectra of the ligand given in the Graph 12 and its complex given in the Graph 13 indicates that the maximum emission wavelength of the ligand is 470 nm and 485 nm for the Zn(II) complex. The red shift of the λmax is due to the deprotonation of the phenolic (OH) group and formation of complex compound of the ligand with the Cu(II) ion (Anita et al., 2006). The intensity of the ligand is also found to be less than the metal complexes. This hyperchromic effect is due to formation of metal complexes as it enhances conformational rigidity and non-radiative energy loss (Majumdar et al., 2006). This study indicates the ligand and its complexes are fluorescent in nature.
Graph 12. Emission graph of the ligand
Graph 13. Emission graph of the Cu(II) complex
Scanning electron micrography
The scanning electron micrography study of the Zn(II) complex is carried out to study its surface morphology given in the Image No. 1. The SEM image indicates the complex particles are appearing sheet like and the size of the particle is 1 µm at high and low resolution. The smaller grain size found from XRD and SEM study indicates that complexes are polycrystalline with nano-sized grain.
Image No. 1. SEM image of the Zn(II) complex
Computational study
A computational study of the investigating compounds is made to examine their reactivities and to evaluate geometrical parameters. Gauss view 4.1 is used to draw the structures and and chemcraft software is used to visualize the optimized geometry. The structures of the ligand and its all metal complexes are optimised at B3LYP (Becke, 1993) level of theory using 6-311++G(d,p) basis set. 6-311++G(d,p) is a large basis set which include diffused and polarised wave functions to take in to account the characteristics associated with ionic species having heavy atoms like N. The harmonic frequency calculation is also carried out at the same level of theory to ensure that the structures are true minima. Optimised was performed without any symmetry constraint using the default convergence criteria provided in the software.
Conceptual DFT defines chemical potential \(\mu\) as the first derivative of energy with respect to number of electrons
\[ \mu=\left(\tfrac{\partial E}{\partial N}\right) \vartheta(r) \]
where \(\mathrm{E}=\) energy, \(\mathrm{N}=\) number of electrons of the system at constant external pressure and chemical hardness \(n\) as the half of the second derivative of energy with respect to number of electrons, so chemical hardness will the first derivative of energy with respect to number of electrons
\[ n=\tfrac{1}{2}\left(\tfrac{\partial \mu}{\partial N}\right) \vartheta(r) \]
But chemical potential \((\mu)\) and chemical hardness \((\mathrm{n})\) are also calculated in most cases in terms ionisation potential(IP) and electron affinity (EA) and, therefore,
\[ \mu=-\left(\tfrac{I P+E A}{2}\right) \text { and } n=\left(\tfrac{I P-E A}{2}\right) \]
According Koopman’s theorem, IP and EA are related to energies of the Highest occupied molecular orbital (EHOMO) and Lowest occupied molecular orbital (ELUMO) in this way \[ \begin{gathered} -IP=-EHOMO\quad \text{and}\quad EA=-ELUMO \\ n=\left( \tfrac{ELUMO-EHOMO}{2}\right)\quad \text{and}\quad \mu=\left(\tfrac{ELUMO+EHOMO}{2}\right) \end{gathered} \]
and Parr and coworkers proposed electrophilicity (Parr & Pearson, 1983) as a measure of electrophilic power of a compound the electrophilicity can be represented as
\[ \mathfrak{W}=\tfrac{\mu 2}{2 n} \]
The chemical potential (µ) and chemical hardness (n), electrophilicity and dipole moment of the ligand and complexes are given in the Table 5. The reactivity of the ligand and its metal complexes can be predicted by considering the minimum electrophilicity principle. According to minimum electrophilicity principle, compound having minimum electrophilicity will have maximum stability. The chemical potential (µ), chemical hardness (n), electrophilicity (Ɯ) are calculated from the HOMO and LUMO value of the ligand given in the Fig. 1 and Fig. 2 and its complexes given in the Fig. 3 to Fig. 10 and presented in the Table 6. The Zn(II), Ni(II) and Cu(II) complexes are more reactive than the ligand and the order of reactivity of the complexes is [Zn2LCl3(H2O)] > [Ni2LCl3(H2O) 5] > Cu2LCl3(H2O) 5] >[Co2LCl3(H2O) 5].
The geometrical parameters of the complex compounds are also collected from their optimised geometry and presented in the Table 6. It is seen from the table that the bond angles around the metal ion in case of Co(II), Ni(II) and Cu(II) complexes are close to 90 and in case of Zn(II) it is close to 109. Therefore, distorted octahedral geometry for Co(II), Ni(II) and Cu(II) complexes and distorted tetrahedral geometry may be suggested for the Zn(II) complex.
Table 5. Selected bond length and bond angle (Å and 0)
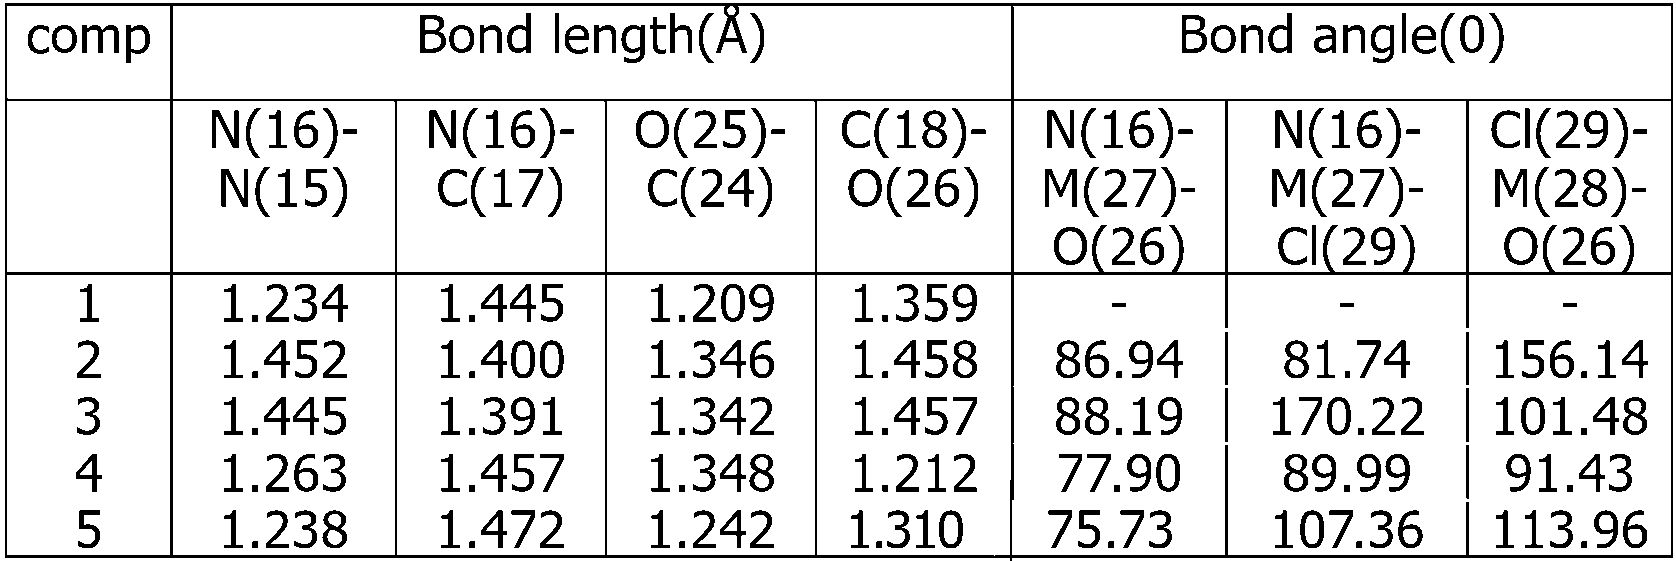
Table 6. Global reactive indices and dipole moment of the investigated compounds
Fig. 3. HOMO of the ligand
Fig. 4. LUMO of the ligand
Fig. 5. HOMO of the Co(II) complex
Fig. 6. LUMO of the Co(II) complex
Fig. 7. HOMO of the Ni(II) complex
Fig. 8. LUMO of the Ni(II) complex
Fig. 9. HOMO of the Cu(II) complex
Fig. 10. LUMO of the Cu(II) complex
Non-linear optical properties
The electronic properties of a compound depend upon its non-linear optical properties and basic requirement for a good non-linear optical material is the easy electron transition between the molecular orbitals. The table indicates that all the metal complexes have small energy gap between the HOMO and LUMO in all complexes as compared to the ligand and dipole moment of the complex compounds are more than the ligand except the Zn(II) complex. This indicates metal complexes have better non-linear optical properties (Soliman et al., 2015) and the order can be represented by [Cu2LCl3(H2O) 5] >[Ni2LCl3(H2O) 5] > [Co2LCl3(H2O) 5]> [Zn2LCl3(H2O)].
Biological study
Antibacterial study
The compounds are screened against gram positive S. aureus and E. coli to ascertain their antibacterial properties. This study indicates all complex compounds are more bacteriostatic than the free ligand and the order of arrangement of compounds according to their antibacterial properties is [Zn2LCl3(H2O)]>[Cu2LCl3(H2O) 5 ]>[Ni2LCl3(H2O) 5]> [Co2LCl3(H2 O) 5]. The enhanced activity of these complex compounds as compared to the ligand may be explained according to the chelation theory. The metal complexes easily pass through the biological cell membrane and inhibit the growth of microorganisms due to increase in their lipophilicity as a result of complex formation.
Graph 14. Antibacterial activity blue- E. coli, Red- S. aureus
DNA binding study
Viscosity measurement study
The complex compounds are subjected to viscosity measurement study given in the Graph 15 in order to examine the binding ability of metal complexes with the CT DNA. The viscosity of the metal complexes increase with increase in their concentration because they intercalate between the base pairs of the DNA causing increase in the length of the helix (Singh et al., 2004) and the increase order of the binding ability is [Co2LCl3(H2O) 5]> [Cu2LCl3(H2O) 5]> [Ni2LCl3(H2O) 5]> [Zn2LCl3(H 2O)].
Graph 15. Viscosity measurement Series 1 Co(II), 2 Cu(II), 3 Ni(II), 4 Zn(II) complexes
Gel electrophoresis study
The gel electrophoresis study given in the Image 2 of the metal complexes is carried out to know their binding ability. The study indicates metal complexes are intercalating in to the base pairs of the DNA and preventing intercalation of tracking dye (Hertzberg & Dervan, 1982). Therefore Intensity of the lane containing the metal complexes is less than the intensity of the lane containing only the CT DNA and the binding power of the Co(II) complex is more than the Zn(II) complex.
Image 2. From left 1 DNA control, 2 Co(II) , 3. Zn(II) complexes
Conclusion
The analytical and spectral study of the ligand suggests tridentate nature of the ligand and it forms metal complexes by coordinating through azo nitrogen, phenolic and aldehydic oxygen atoms. The metal complexes are polycrystalline with nano-sized grain according to the study of XRD and SEM image. The global reactive indices indicate that metal complexes are more reactive than than the ligand. The ligand and metal complexes have photoconducting properties, non-linear optical properties as indicated from the fluorescence study and non-linear optical properties study respectively. The antibacterial study indicates that metal complexes are more potent than the ligand and complexes have DNA binding abilities as suggested from binding ability study.
REFERENCES
Abdel-Rahman, L.H., El-Khatib, R.M., Nassr, L.A., Abu-Dief, A.M. & Lashin, F.-D. (2013). Design, characterisation, teratogenicity testing, antibacterial, antifungal and DNA interaction of few high spin Fe(II) Schiff base complexes. Spectrohimica Acta A, 111, 266 – 276.
Aljahdalia, M.S., El-Sherif, A.A., Hilal, R.H. & Abdel-Karim, A.T. (2013). Mixed bivalent transition metal complexes of 1,10 phenanthroline and 2-aminomethylthiophenyl-4-bromosalicylaldehyde Schiff base; spectroscopic, molecular modelling and biological activities. Eur. J. Chem. , 4, 370 – 378.
Anita, C., Sheela, C.D., Tharmaraj, P. & Sumathi, S. (2006). Spectroscopic studies and biological evaluation of some transition metal complexes of azo Schiff base ligand derived from (1-phenyl-2,3-dimethyl-4-aminopyrazole-5-one) and 5-((4-chlorophenyl)diazenyl)-2-hydroxybenzaldehyde. Spectrochimica Acta A, 96, 493 – 500.
Ayesha, T., Lyčka, A., Luňák Jr., S., Machalicky, O., Elsedik, M. & Hirdina, R. (2013). Synthesis and spectral properties of new hydrazone dyes and their Co(III) complexes. Dyes & Pigments, 98, 547 – 556.
Becke, A.D. (1993). Density funtional thermochemistry - 3: the role of exact exchange. J. Chem. Phys., 98, 5648 – 5652.
Chohan, Z.H., Sumrra, S.H., Youssoufi, M.H. & Hadda, T.B. (2010). Metal based biologically active compounds: design, synthesis and antibacterial/antifungal/cytotoxic properties of triazole-derived schiff bases and their oxovanadium(IV). Eur. J. Med. Chem. , 45, 2739 – 2747.
Dholakiya, P.P. & Patel, M. N. (2002). Preparation, magnetic, spectral, biocidal studies of transition metal complexes with 3,5-dibromosalicylideneaniline and neutral bidentate ligands. Synthesis & Reactivity Inorg. Metal-Org. Chem., 32, 819 – 829.
Dutta, R.L. & Syamal, A. (2010). Elements of magnetochemistry, New Delhi: East –West Press.
El-Sherif, A.A. & Eldebss, T.M. (2011). Synthesis, spectral characterization, solution equilibria, in vitro antibacterial and cytotoxic activities of Cu(II), Ni(II), Mn(II), Co(II) and Zn(II) complexes with Schiff base derived from 5-bromosalicylaldehyde and 2-aminomethylthiophene. Spectrochima Acta A, 79, 1803 – 1814.
Frisch, F., Trucks, G., Schlegel, H., Scuseria, G. Robb, M., Cheeseman Jr., J., Montgomwry, J., Ureven, T., Kudin, K. & Burant, J. .(2003). Gaussian 03 Rev B. O3. Pittusberg: Gaussian Inc.
Geary, W.J. (1971). The use of conductivity measurement in organic solvents for the measurement of coordination compounds. Coordination Chem. Rev. , 7, 81 – 122.
Gong, G., Gao, X., Wang, J., Zhao, D. & Freeman, H.S. (2002). Trisazodirectblack dyesbasedonnonmutagenic3,3′-disubstitutedbenzidines. Dyes&Pigments, 53, 109 – 117.
Hallas, G. & Choi, J.-H. (1999). Synthesis and properties of novel aziridyline azo from 2-aminothiophene - part 2: application of some disperse azo dyes polyster fibres. Dyes & Pigments, 40, 119 – 129.
Hathaway, B.J. & Billing, D.E. (1970). The electronic properties and stereochemistry of mononuclear complexes of the Cu(II) ion. Coordination Chem. Rev. , 5, 143 – 207.
Hertzberg, R.P. & Dervan, P.B. (1982). Cleavage of double helical DNA by (methidium propyl-EDTA)Iron(II). J. Amer. Chem. Soc., 104, 313 – 315.
Kivelson, D. & Neiman, R.R. (1970). ESR studies on the bonding in copper complexes. J. Chem. Phys., 35, 149 – 155.
Lever, A B.P. (1968). The electronic spectra of tetragonal metal complexes analysis and significance. Coordination Chem. Rev., 3, 119 – 140.
Lever, A.B.P. & Solomon, E.I. (2014). Inorganic electronic structure and spectroscropy, New York: Wiley.
Maiti, S., Maiti, P., Sinha, S.S., Mitra, R.K. & Pal, S.K. (2009). Molecular recognition of plant DNA: does it differ from conventional animal DNA. Int. J. Biol. Macromolecules, 44, 133 – 137.
Majumdar, A., Rosair, G.M., Mallick, A., Chattopadhya, N. & Mitra, S. (2006). Synthesis, structure and fluorescence of nickel, zinc and cadmium complexes with the tridentate-N,N,O Schiff base N-2-pyridylmethylidene-2-hydroxy-phenylamine. Polyhedron, 25, 1753– 1762.
Nakamoto, K. (2009). Infrared and raman spectra of inorganic and coordination compounds. New York: Wiley. .
Navarro, A. & Sanz, F. (1999). Dyes aggregation in solution study of C.I. direct red. Dyes & Pigments, 40, 131 – 139.
Parr, R.G. & Pearson, R.G. (1983). Absolute hardness: companion parameter to absolute electronegativity. J. Amer. Chem. Soc., 105, 7512 – 7516.
Robinson, S.D. & Uttley, M.F. (1973). Complexes of the platinum metals - part II: carboxylato(triphenyl phosphine) derivative of ruthenium, osmonium, rhodium and iridium. J. Chem. Soc.: Dalton Trans., No. 18, 1912 – 1920.
Routier, S., Bernier, J.-L., Waring, M.J., Colson, P., Houssier, C. & Bailly, C. (1996). Synthesis of functionalized salen-copper complex and its interaction with DNA. J. Org. Chem., 61, 2326 – 2331.
Saxena, A. & Tandon, J.P. (1984). Structural features of some organotin(IV) complexes of semi- and thio-semicarbazone. Polyhedron, 3, 681 – 688.
Shakir, M., Nasman, O.S.M., Mohammed, A.K. & Varkey, S.P. (1996). Transition metal complexes with 13-14 membered tetrazamacrocycles: synthesis and characterization. Polyhedron, 15, 1283 – 1287.
Singh, R.V., Dwivedi, R. & Joshi, S.C. (2004). Synthetic, magnetic, spectral, antibacterial and antifertility studies of dioxomolybdenum(VI) unsymmetrical imine complexes having N ∩ N donor system. Trans. Metal Chem., 29, 70 – 74.
Soliman, S.M., Abu-Youssef, M.A.M., Albering, J. & El-Faham, A. (2015). Molecular structure and DFT investigations on new Co(II) chloride complex with superbase guanidine type ligand. J. Chem. Sci., 127, 2137 – 2149.
Stefov, V., Hergold-Brundić, A., Šoptrajanov, B. & Jovanovski, G. (2004). Triscesium trans-tetraaquo chlorovanadium(III)tetrachloride: redetermination of crystal sytructure and Infrared study of water spectrum. J. Mol. Structure, 707, 109 – 114.
Sujiki, Y., Okamato, Y., Kurose, Y. & Maeda, S. (1999). High-speed recording performance of metal azo dye containing digital video-discs recordable discs. Jap. J. Appl. Phys., 38, 1669 – 1674.
Tao, J., Mao, G. & Daehne, L. (1999). Asymmetric molecular aggregation in spherulitic dye film. J. Amer. Chem. Soc., 121, 3475 – 3485.
Williams, D.H. & Fleming, I. (1994). Spectroscopic methods in organic chemistry. New York: McGraw Hill Education.
Yamada, S. (1966). Recent aspects of the stereochemistry of Schiff base metal complexes. Coordination Chem. Rev., 1, 415 – 437.